
Bridge is the internal admin portal for the Water Restrictions platform. It manages areas, organisations, and restriction schemes, and is the primary tool for configuring and monitoring the scraping pipeline that powers the Water Restrictions Website. Feedback submissions from the website are reviewed and managed in Bridge, and a full domain events log provides an audit trail of all important system changes.
Dashboard
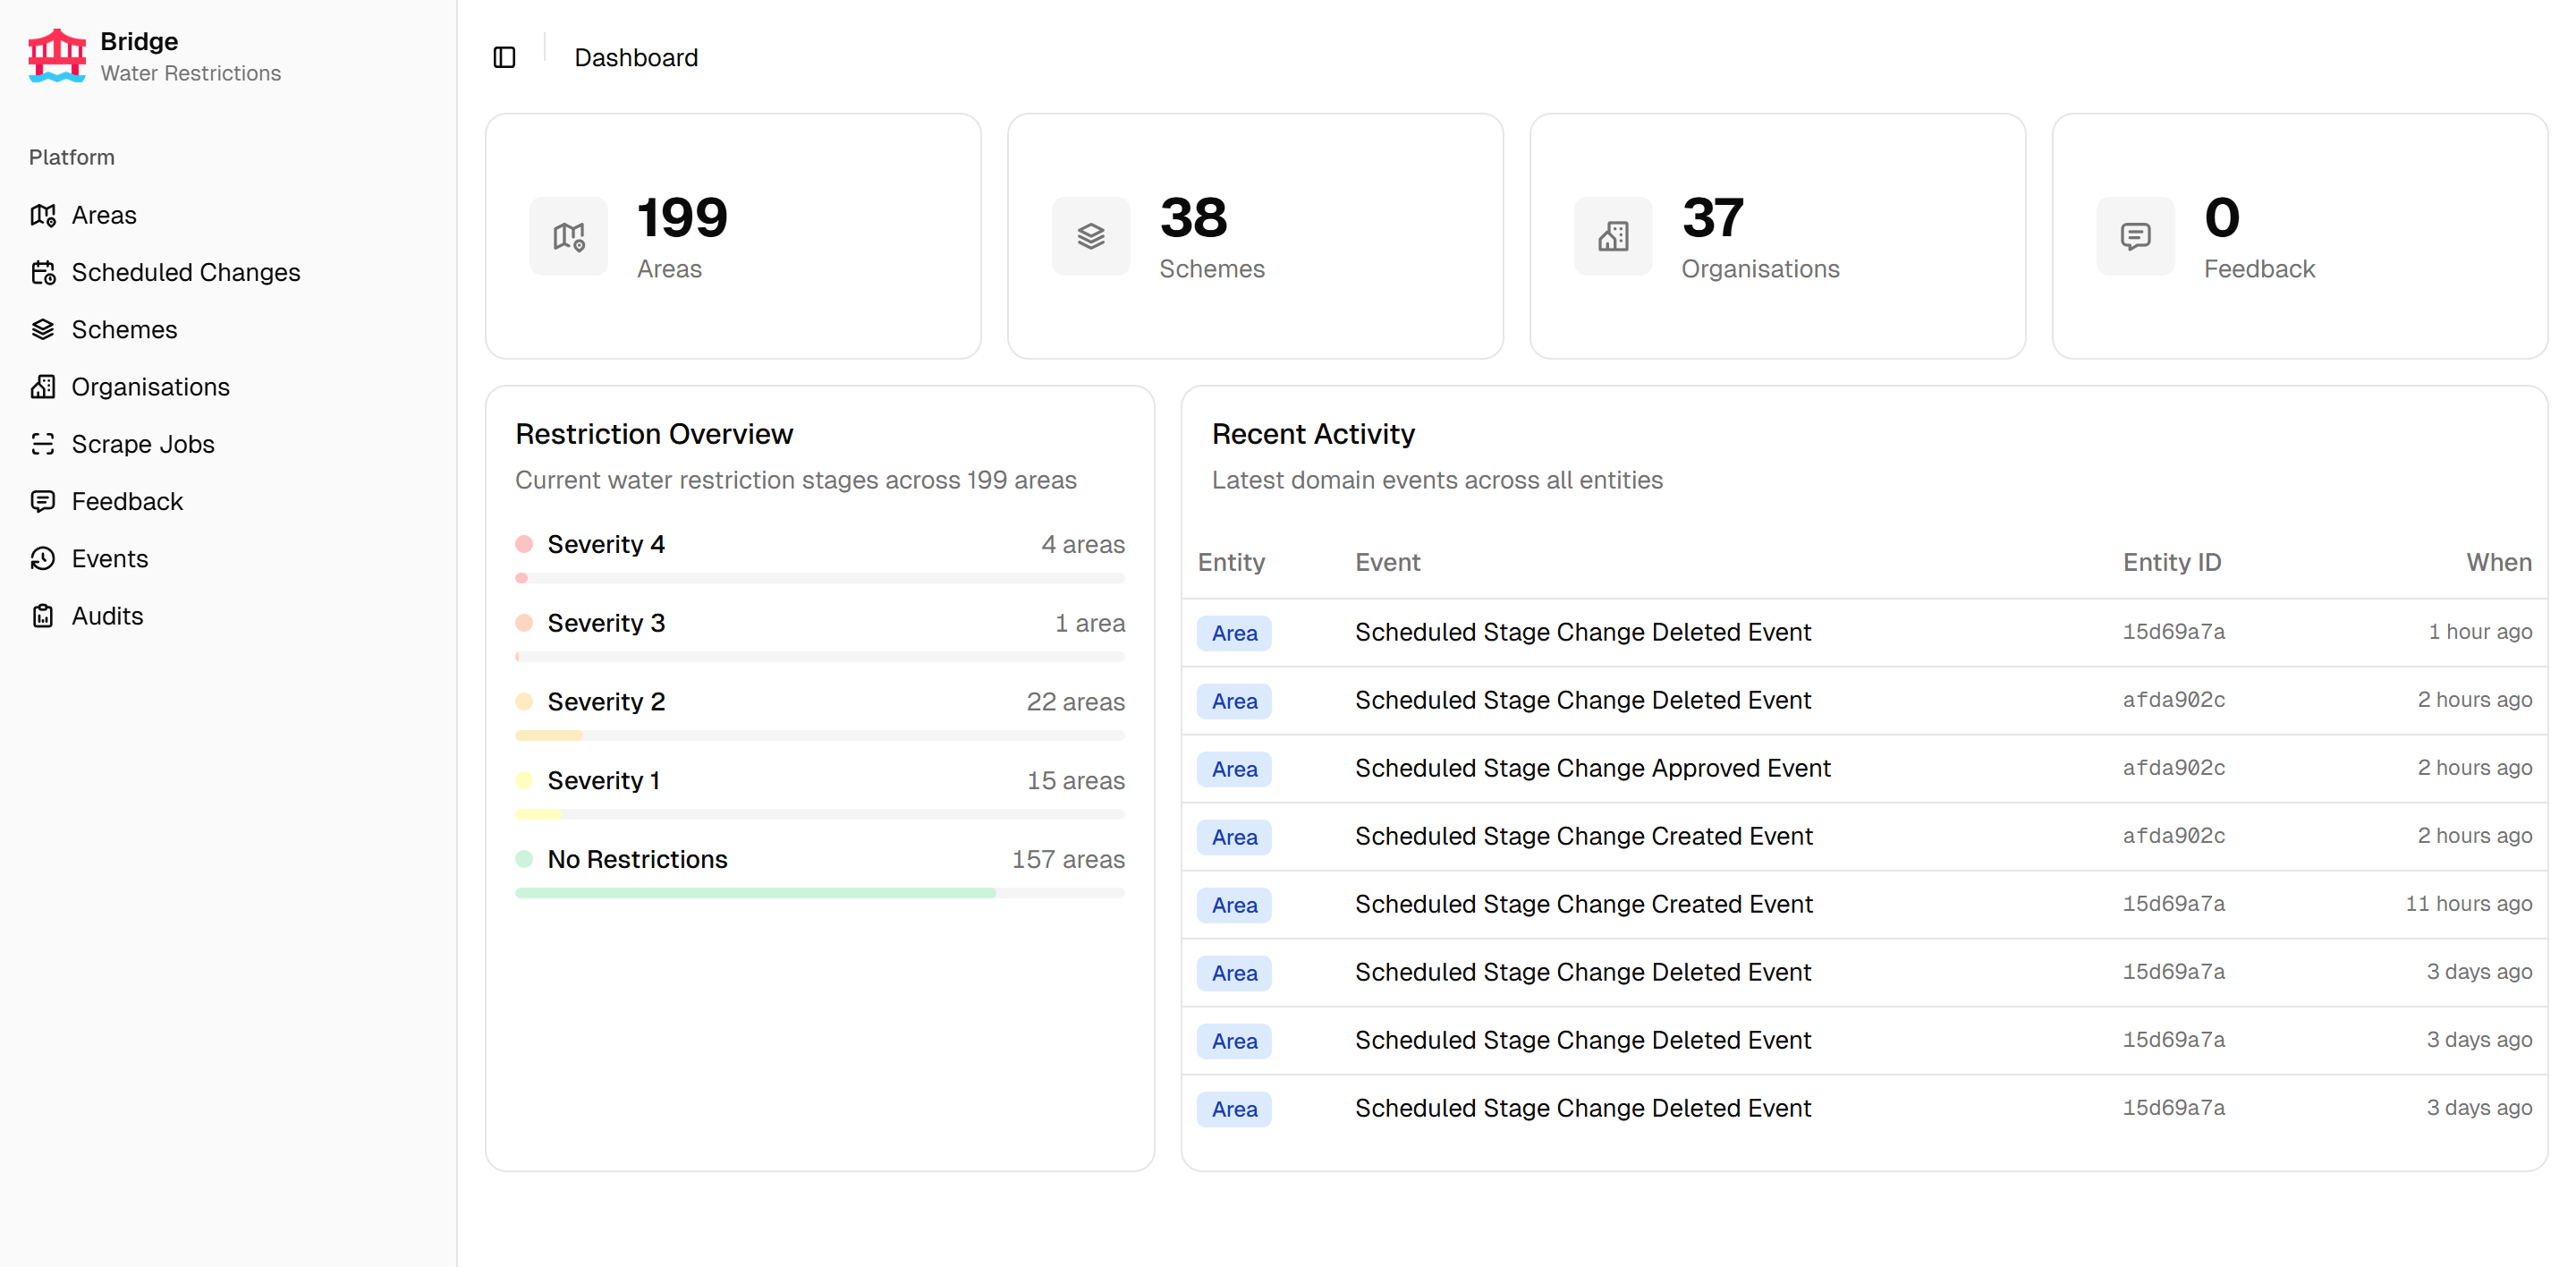
The dashboard provides an at-a-glance view of the platform’s current state. Stat cards show key platform counts. A restriction severity overview displays the current distribution of areas across restriction stages as colour-coded progress bars. A recent activity feed lists the latest domain events across all entities in the system.
Domain events
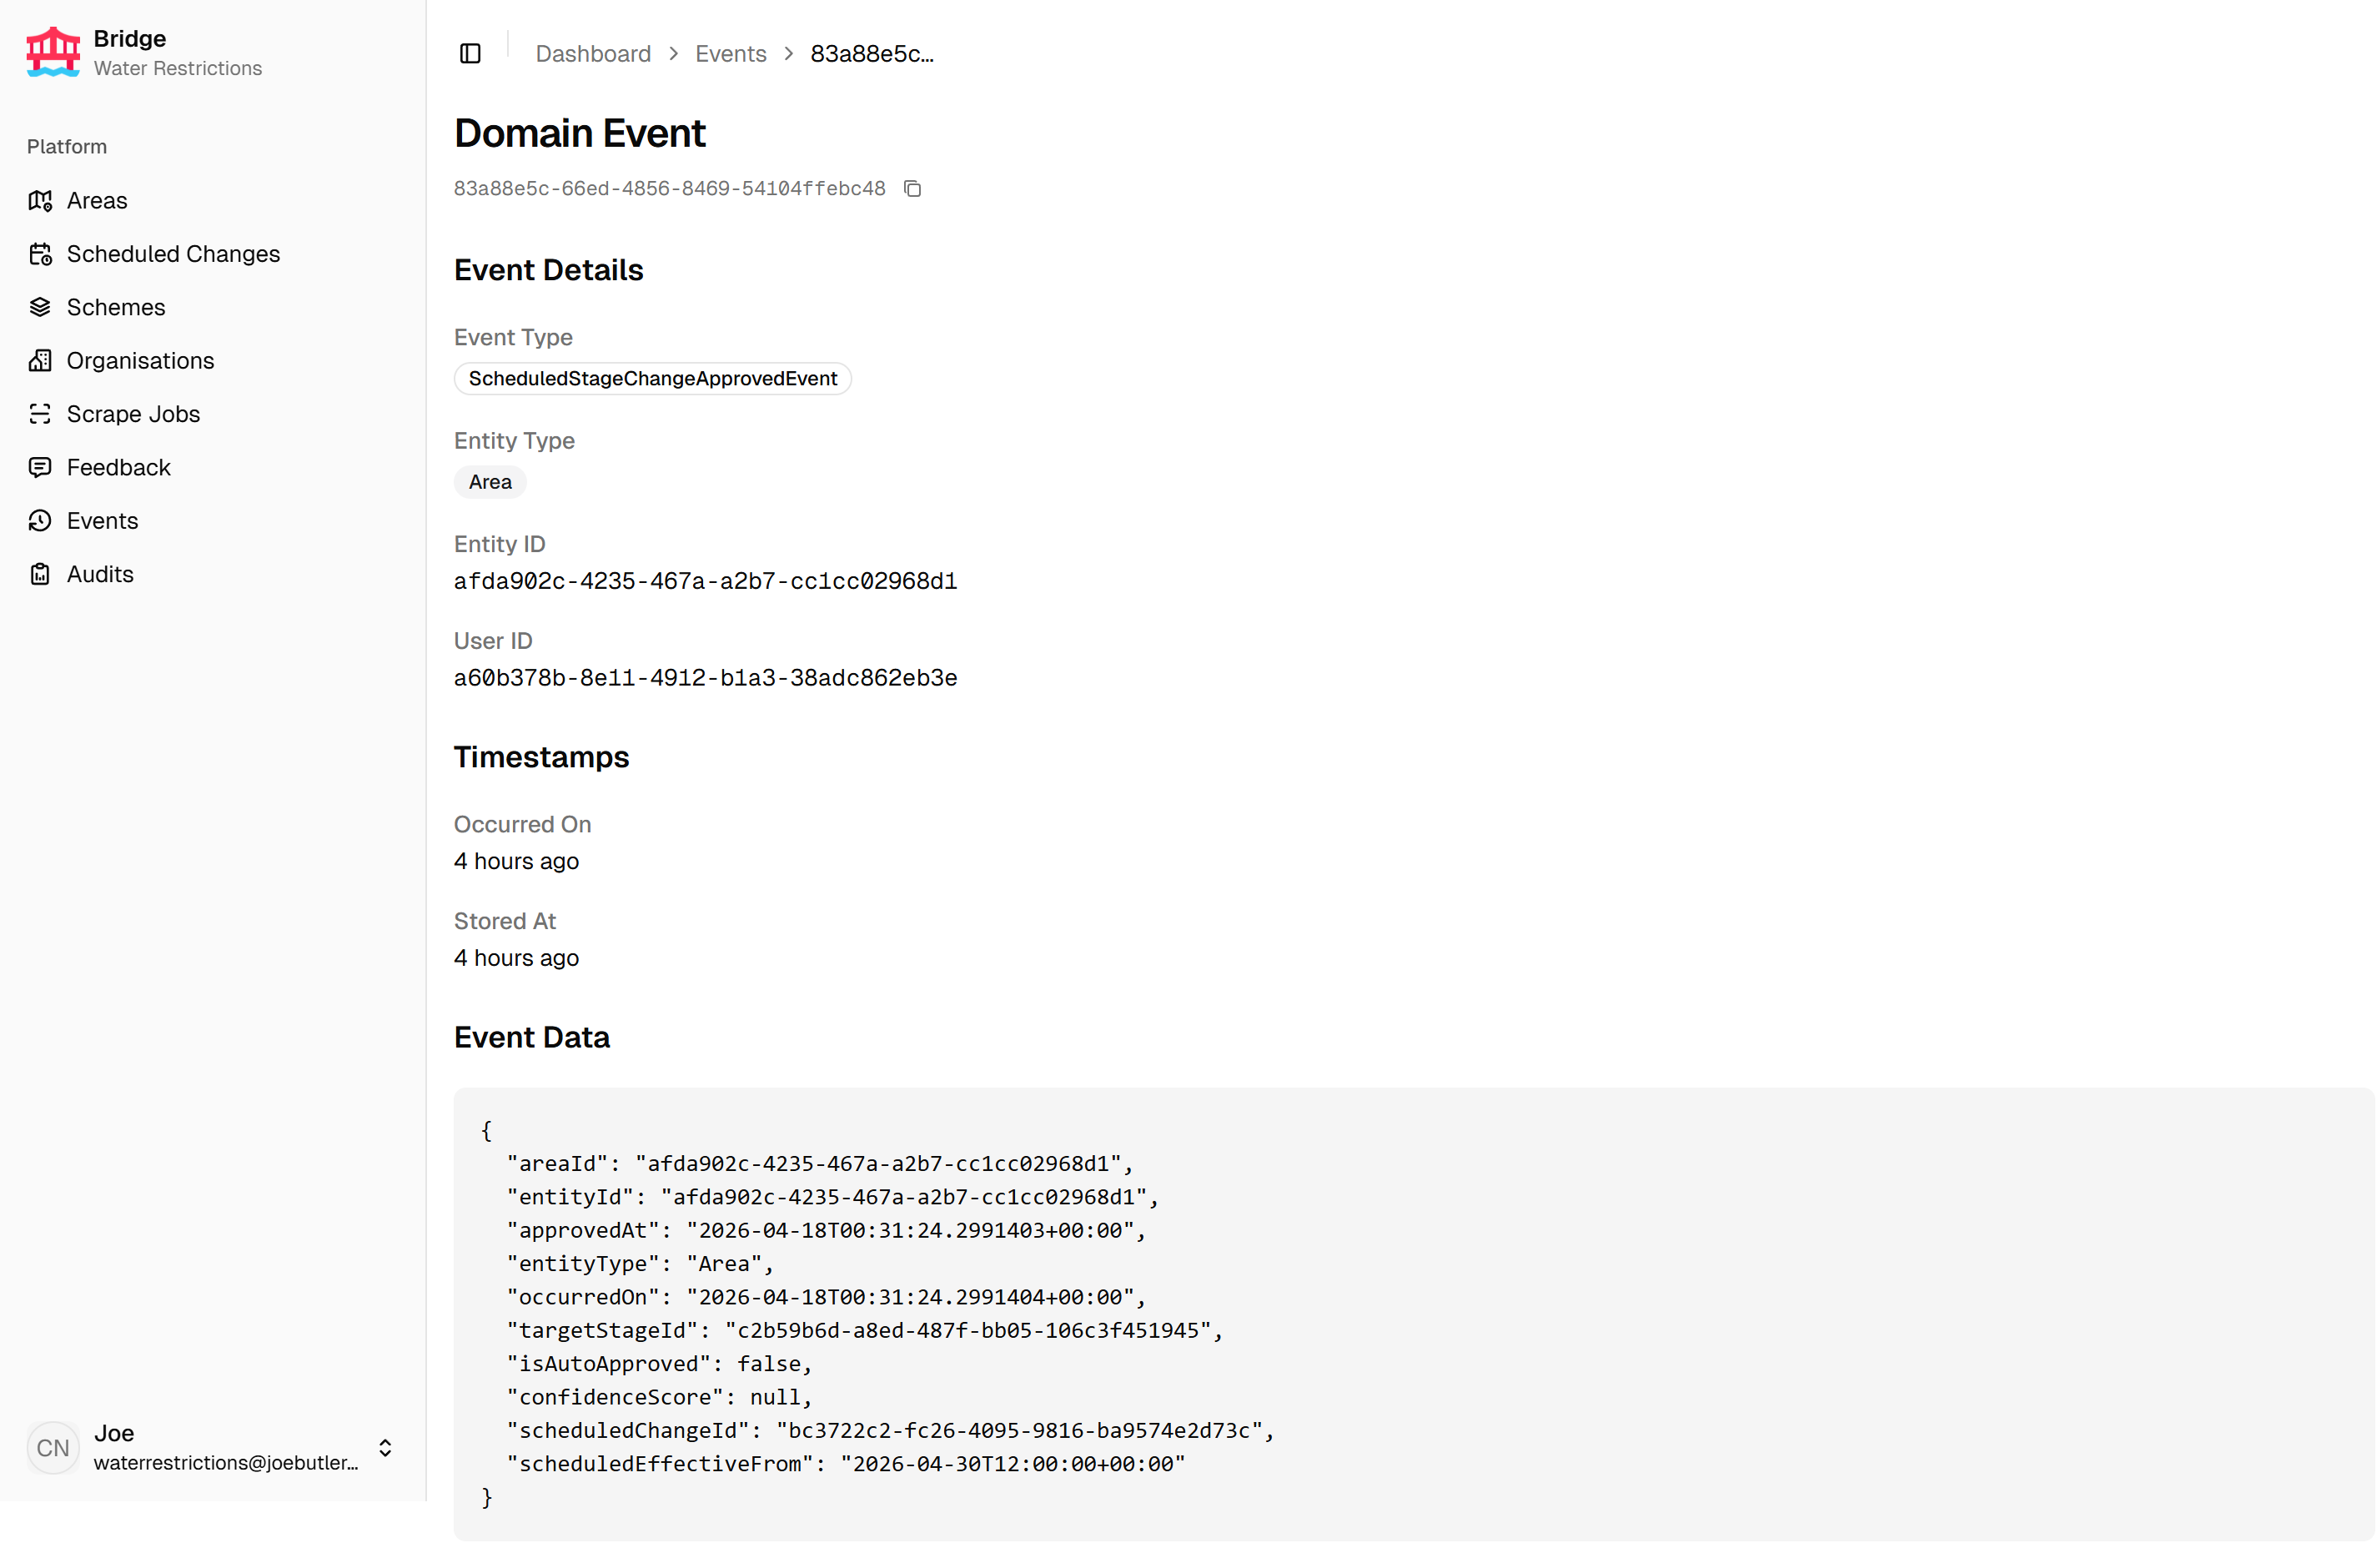
The domain events log provides a paginated record of all system changes. Each entry can be opened to inspect the full event payload as formatted JSON.
Areas
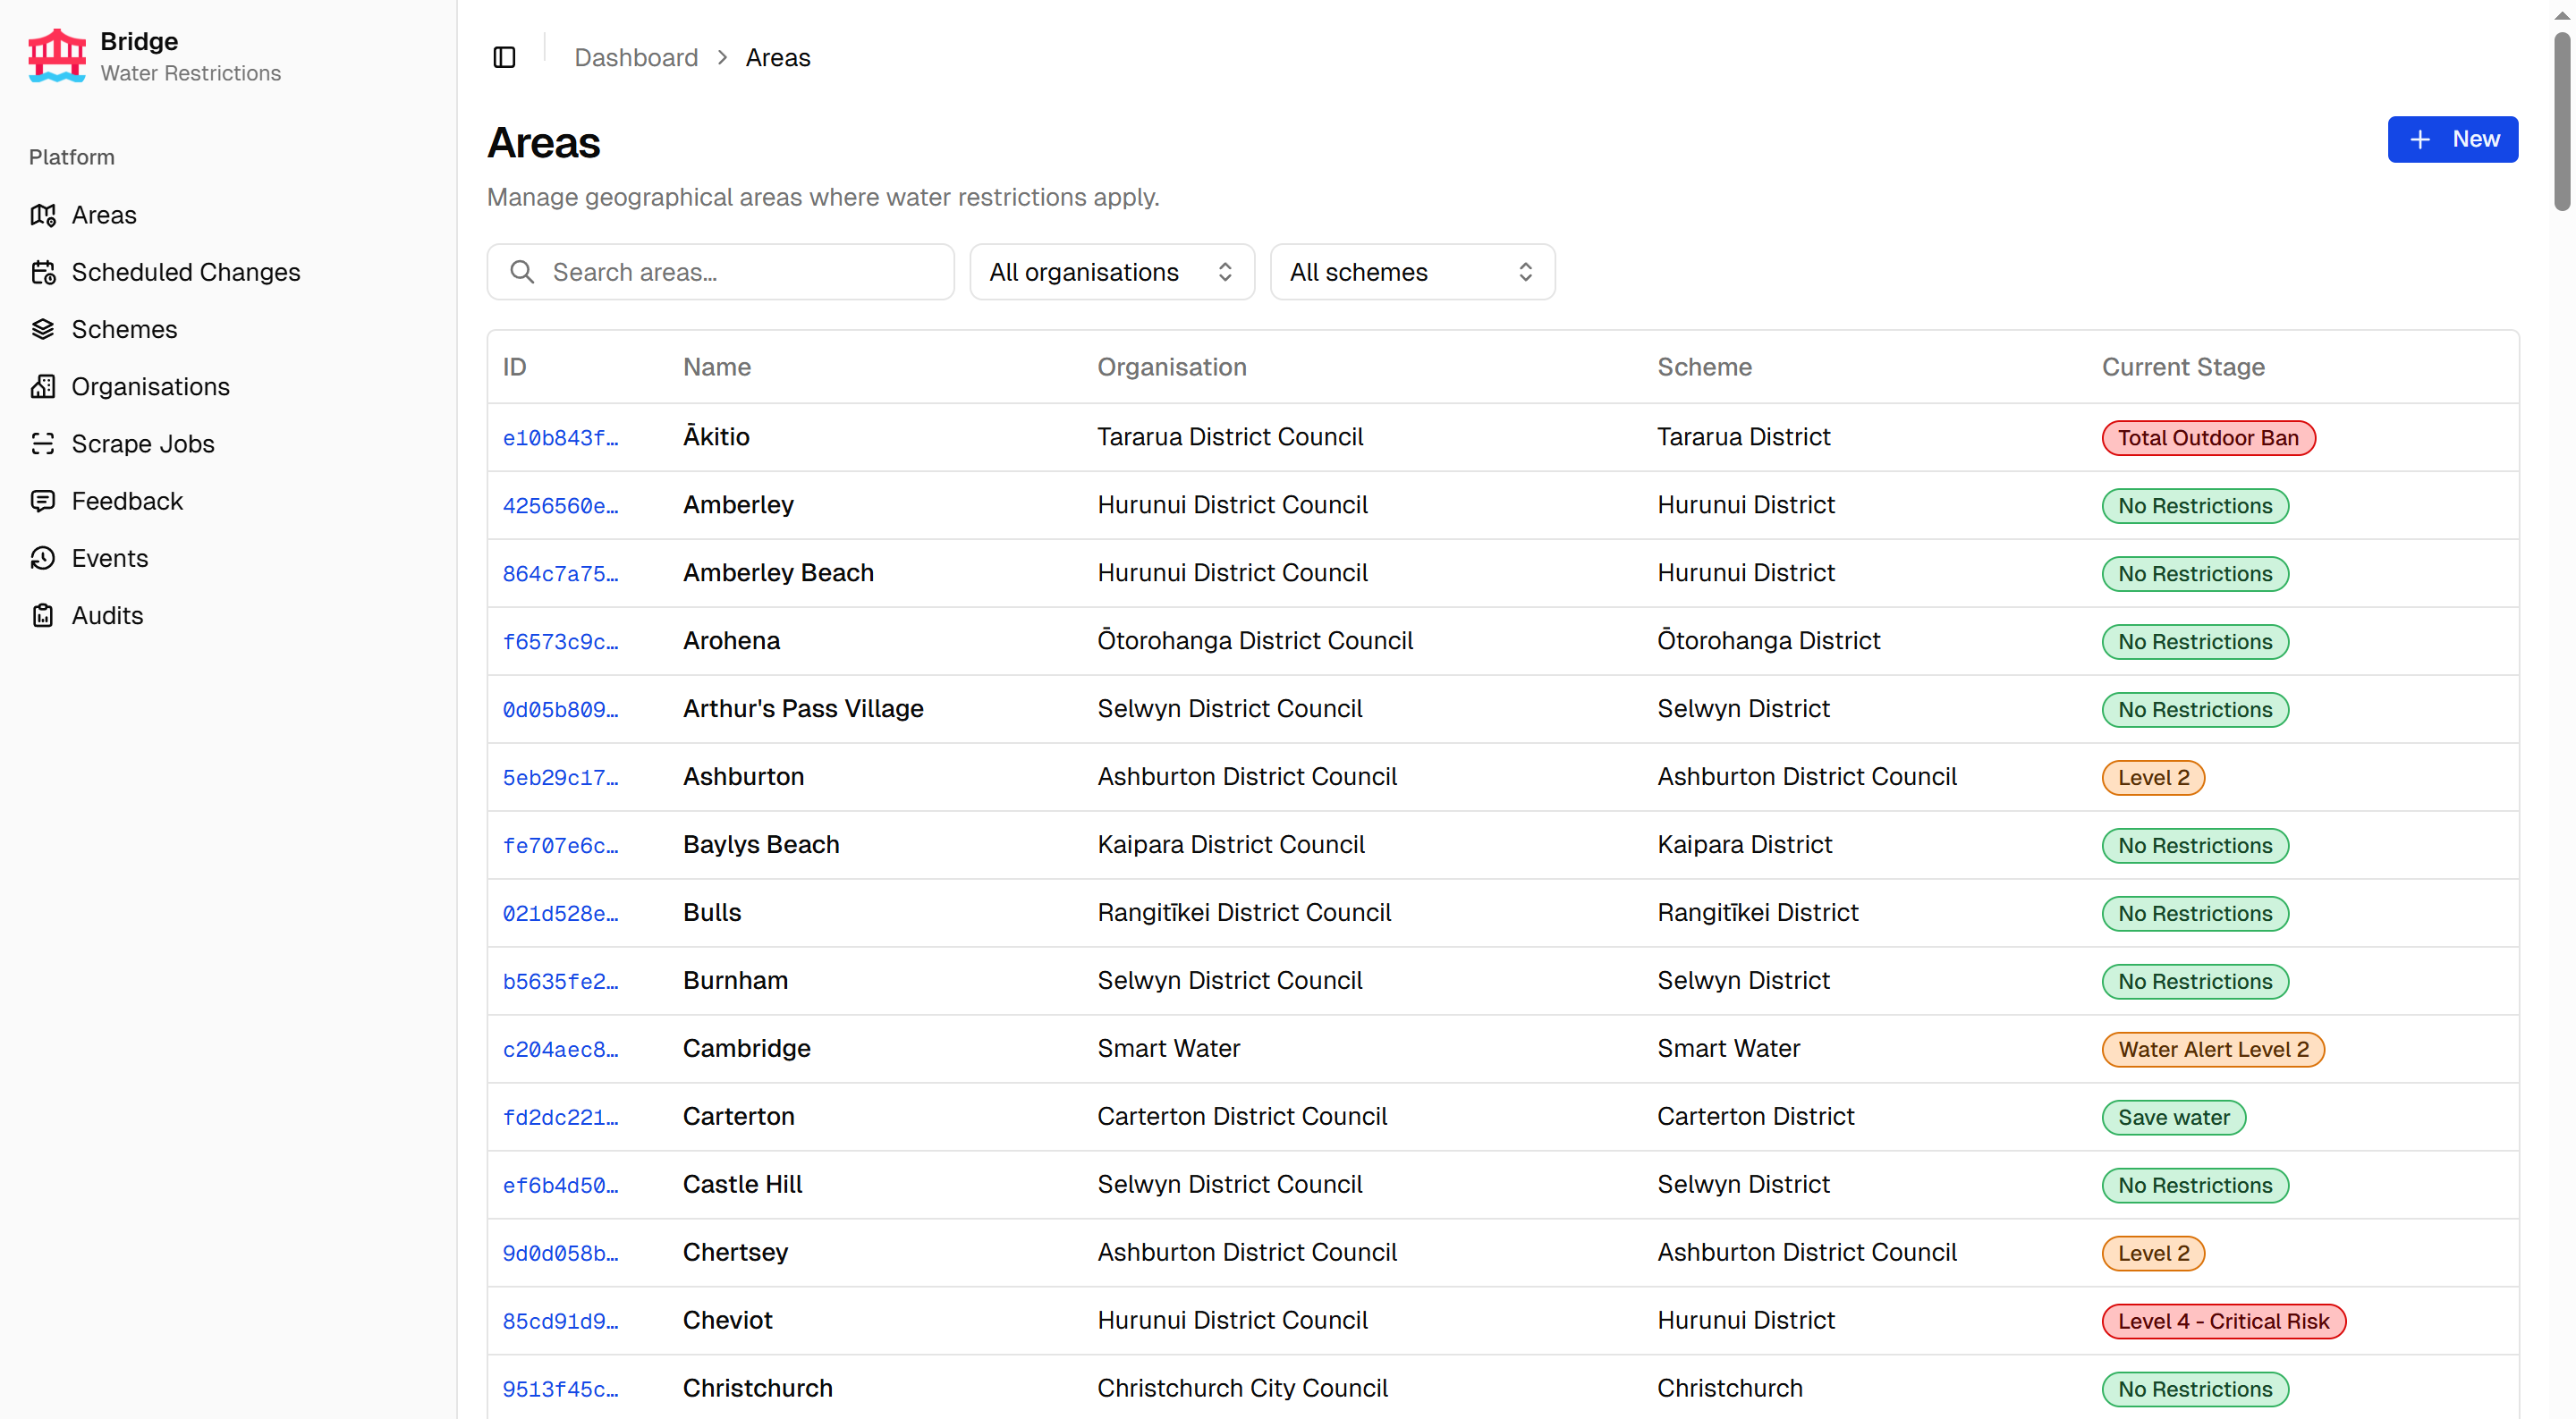
The areas list is searchable and filterable by organisation and scheme. Each row shows details about the area, including the current stage as a colour-coded badge.
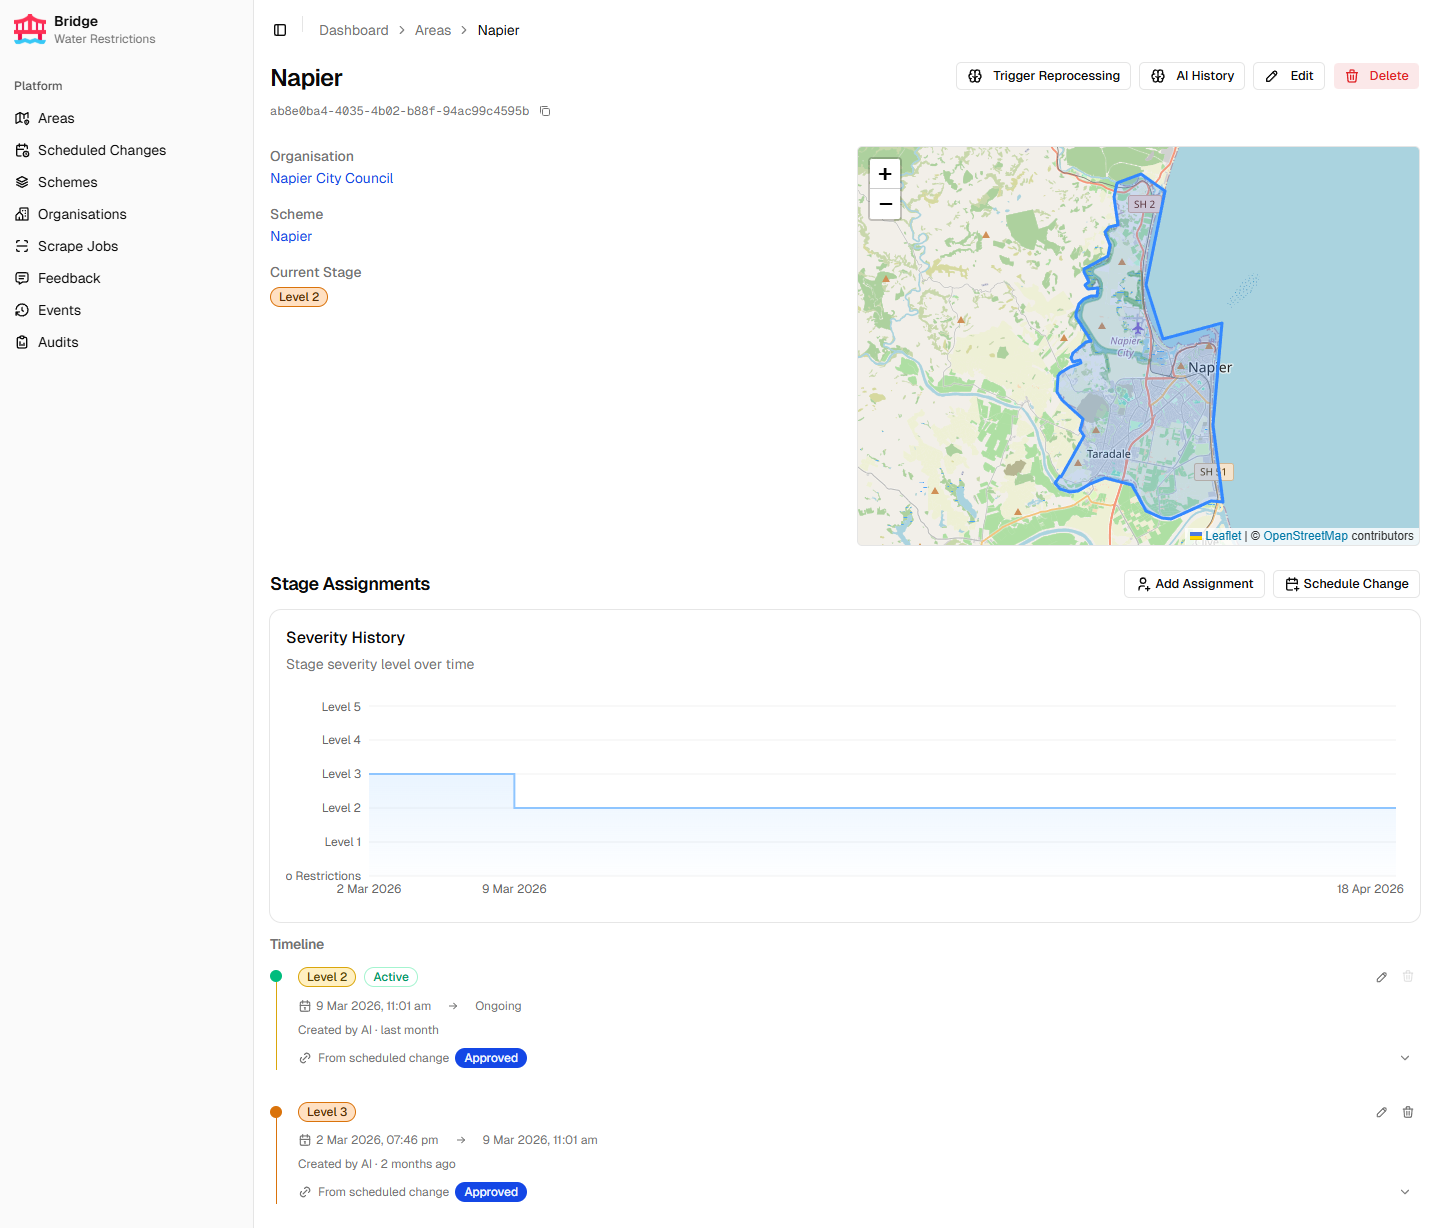
Each area has a detail page showing the current stage, a severity history chart tracking restriction level changes over time, a stage timeline of past assignments, and the area boundary on an interactive map.
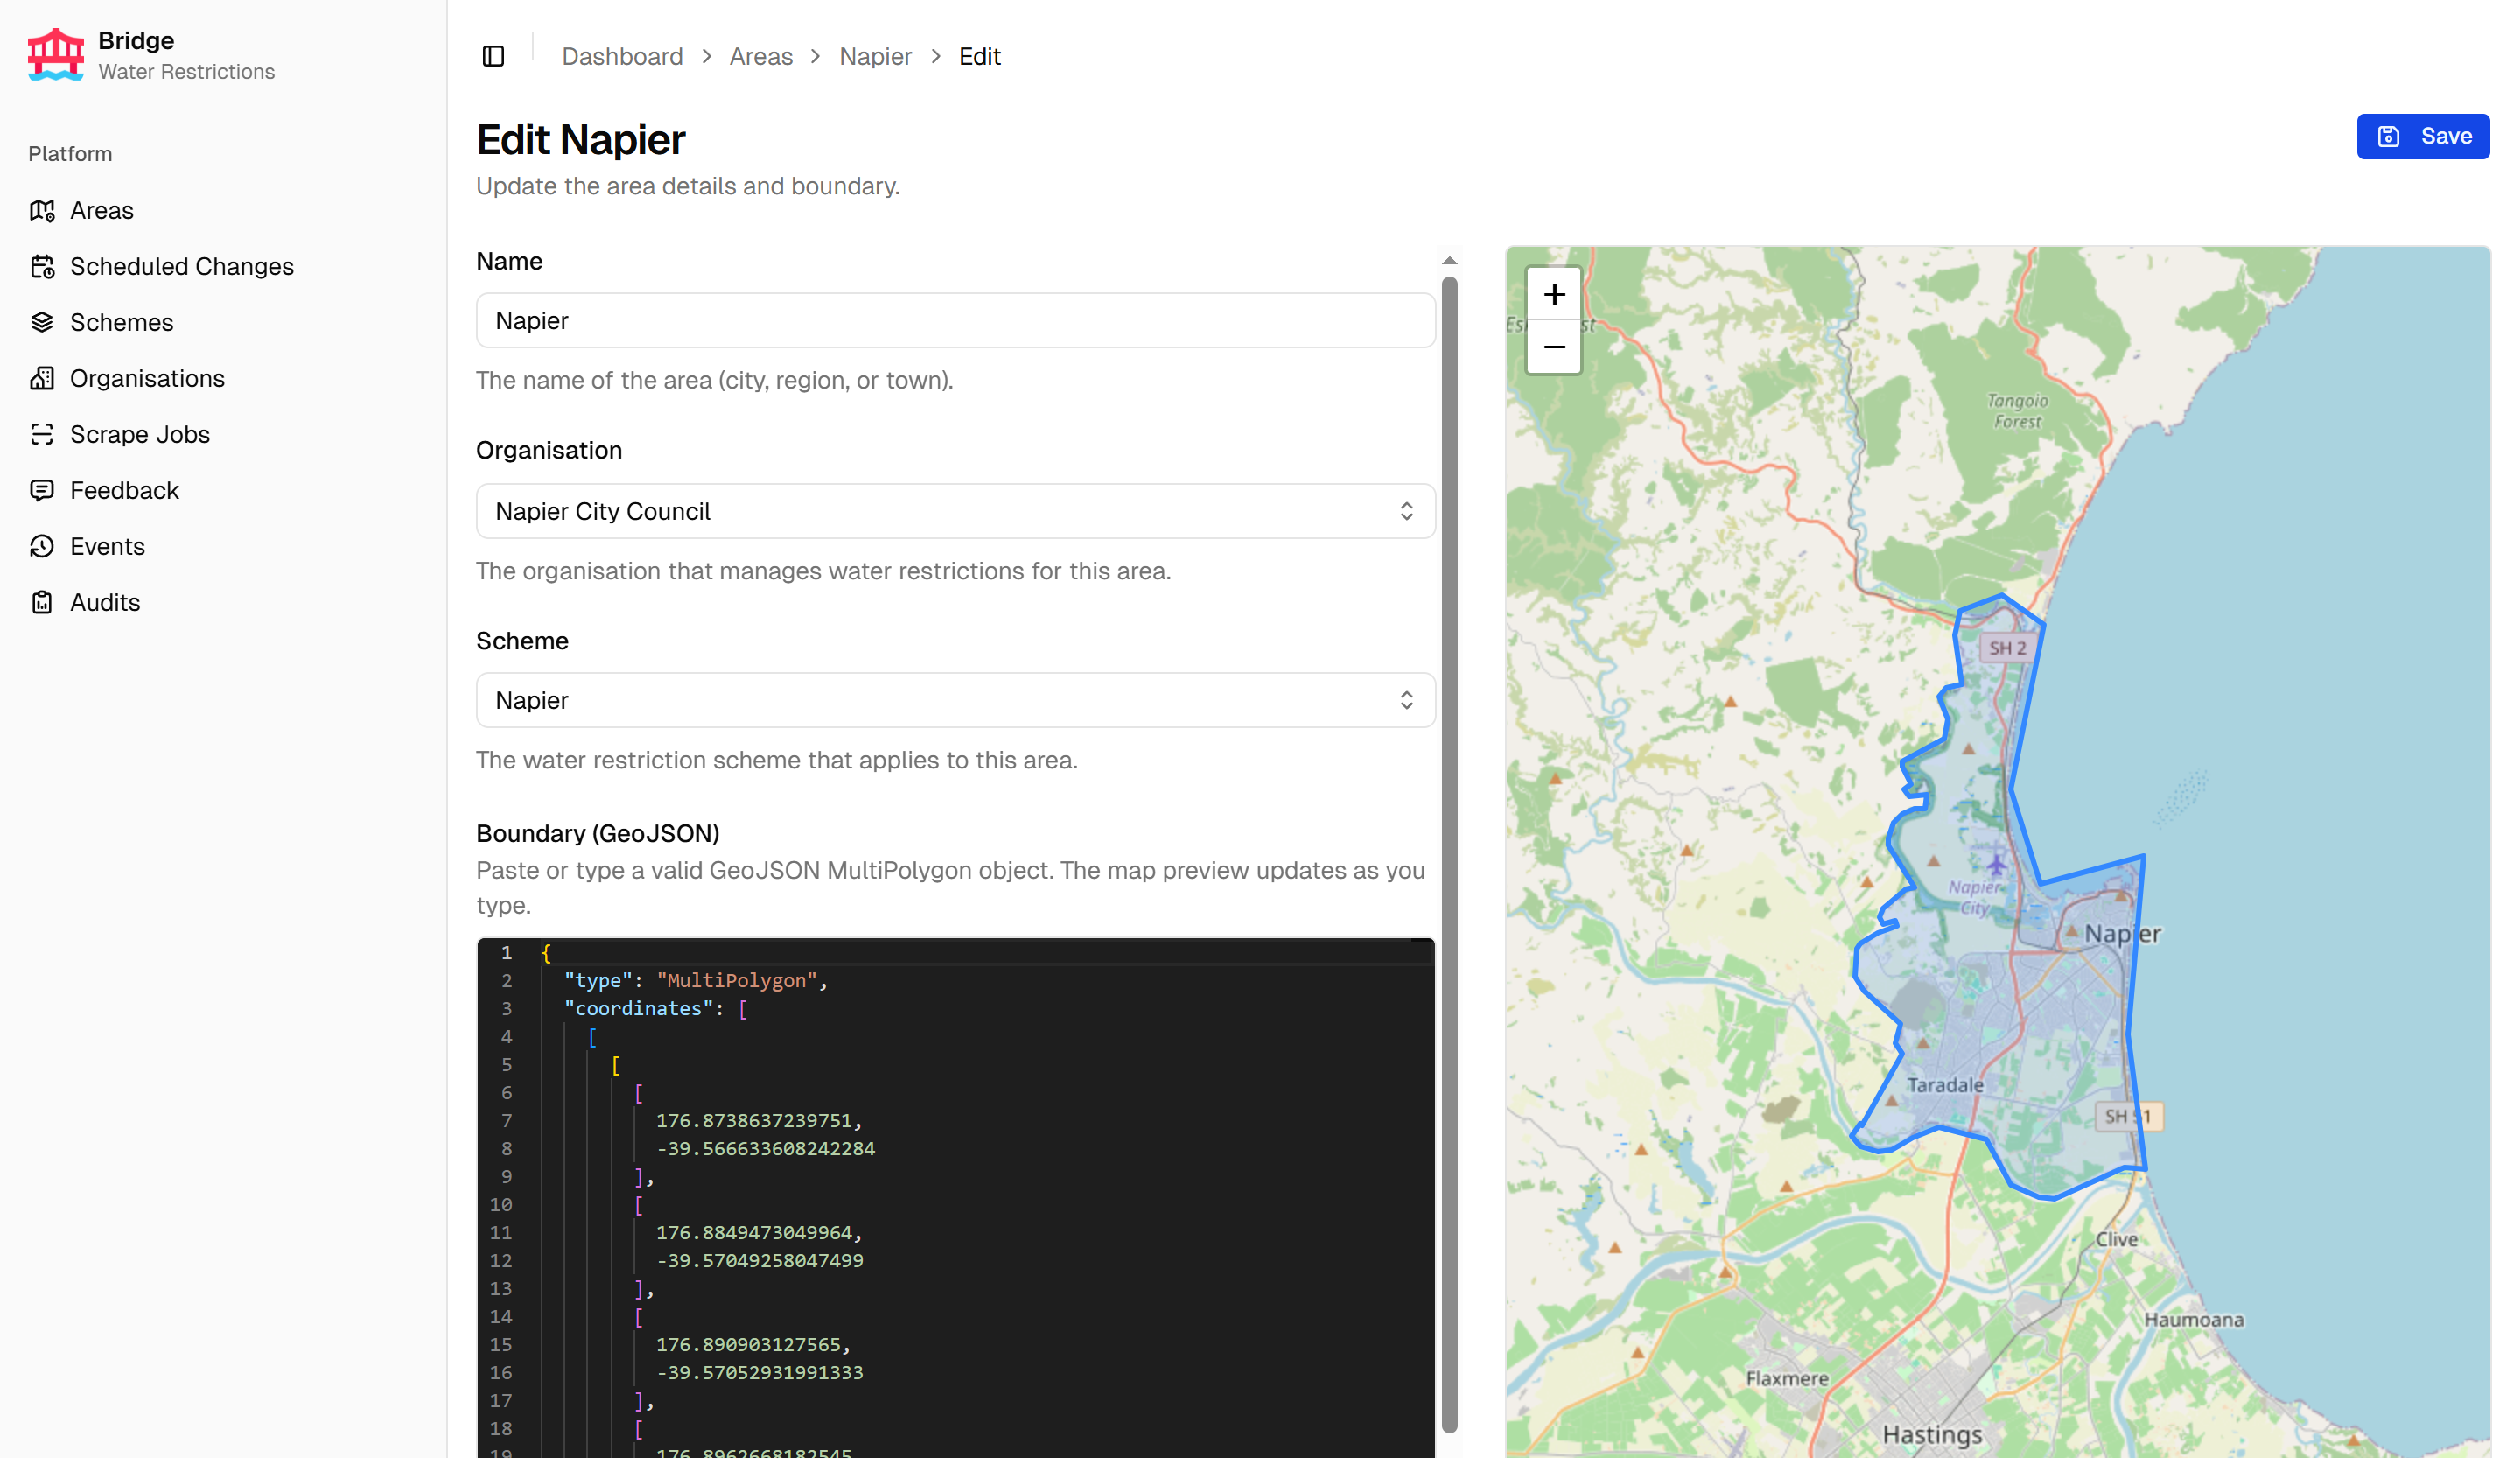
Areas are edited on a dedicated page with a Monaco GeoJSON editor and a live map preview that updates as the boundary changes.
Scraping pipeline
Organisations group the scraping sources — the URLs monitored for restriction updates. Per-source settings and organisation-wide reprocessing are managed per organisation.
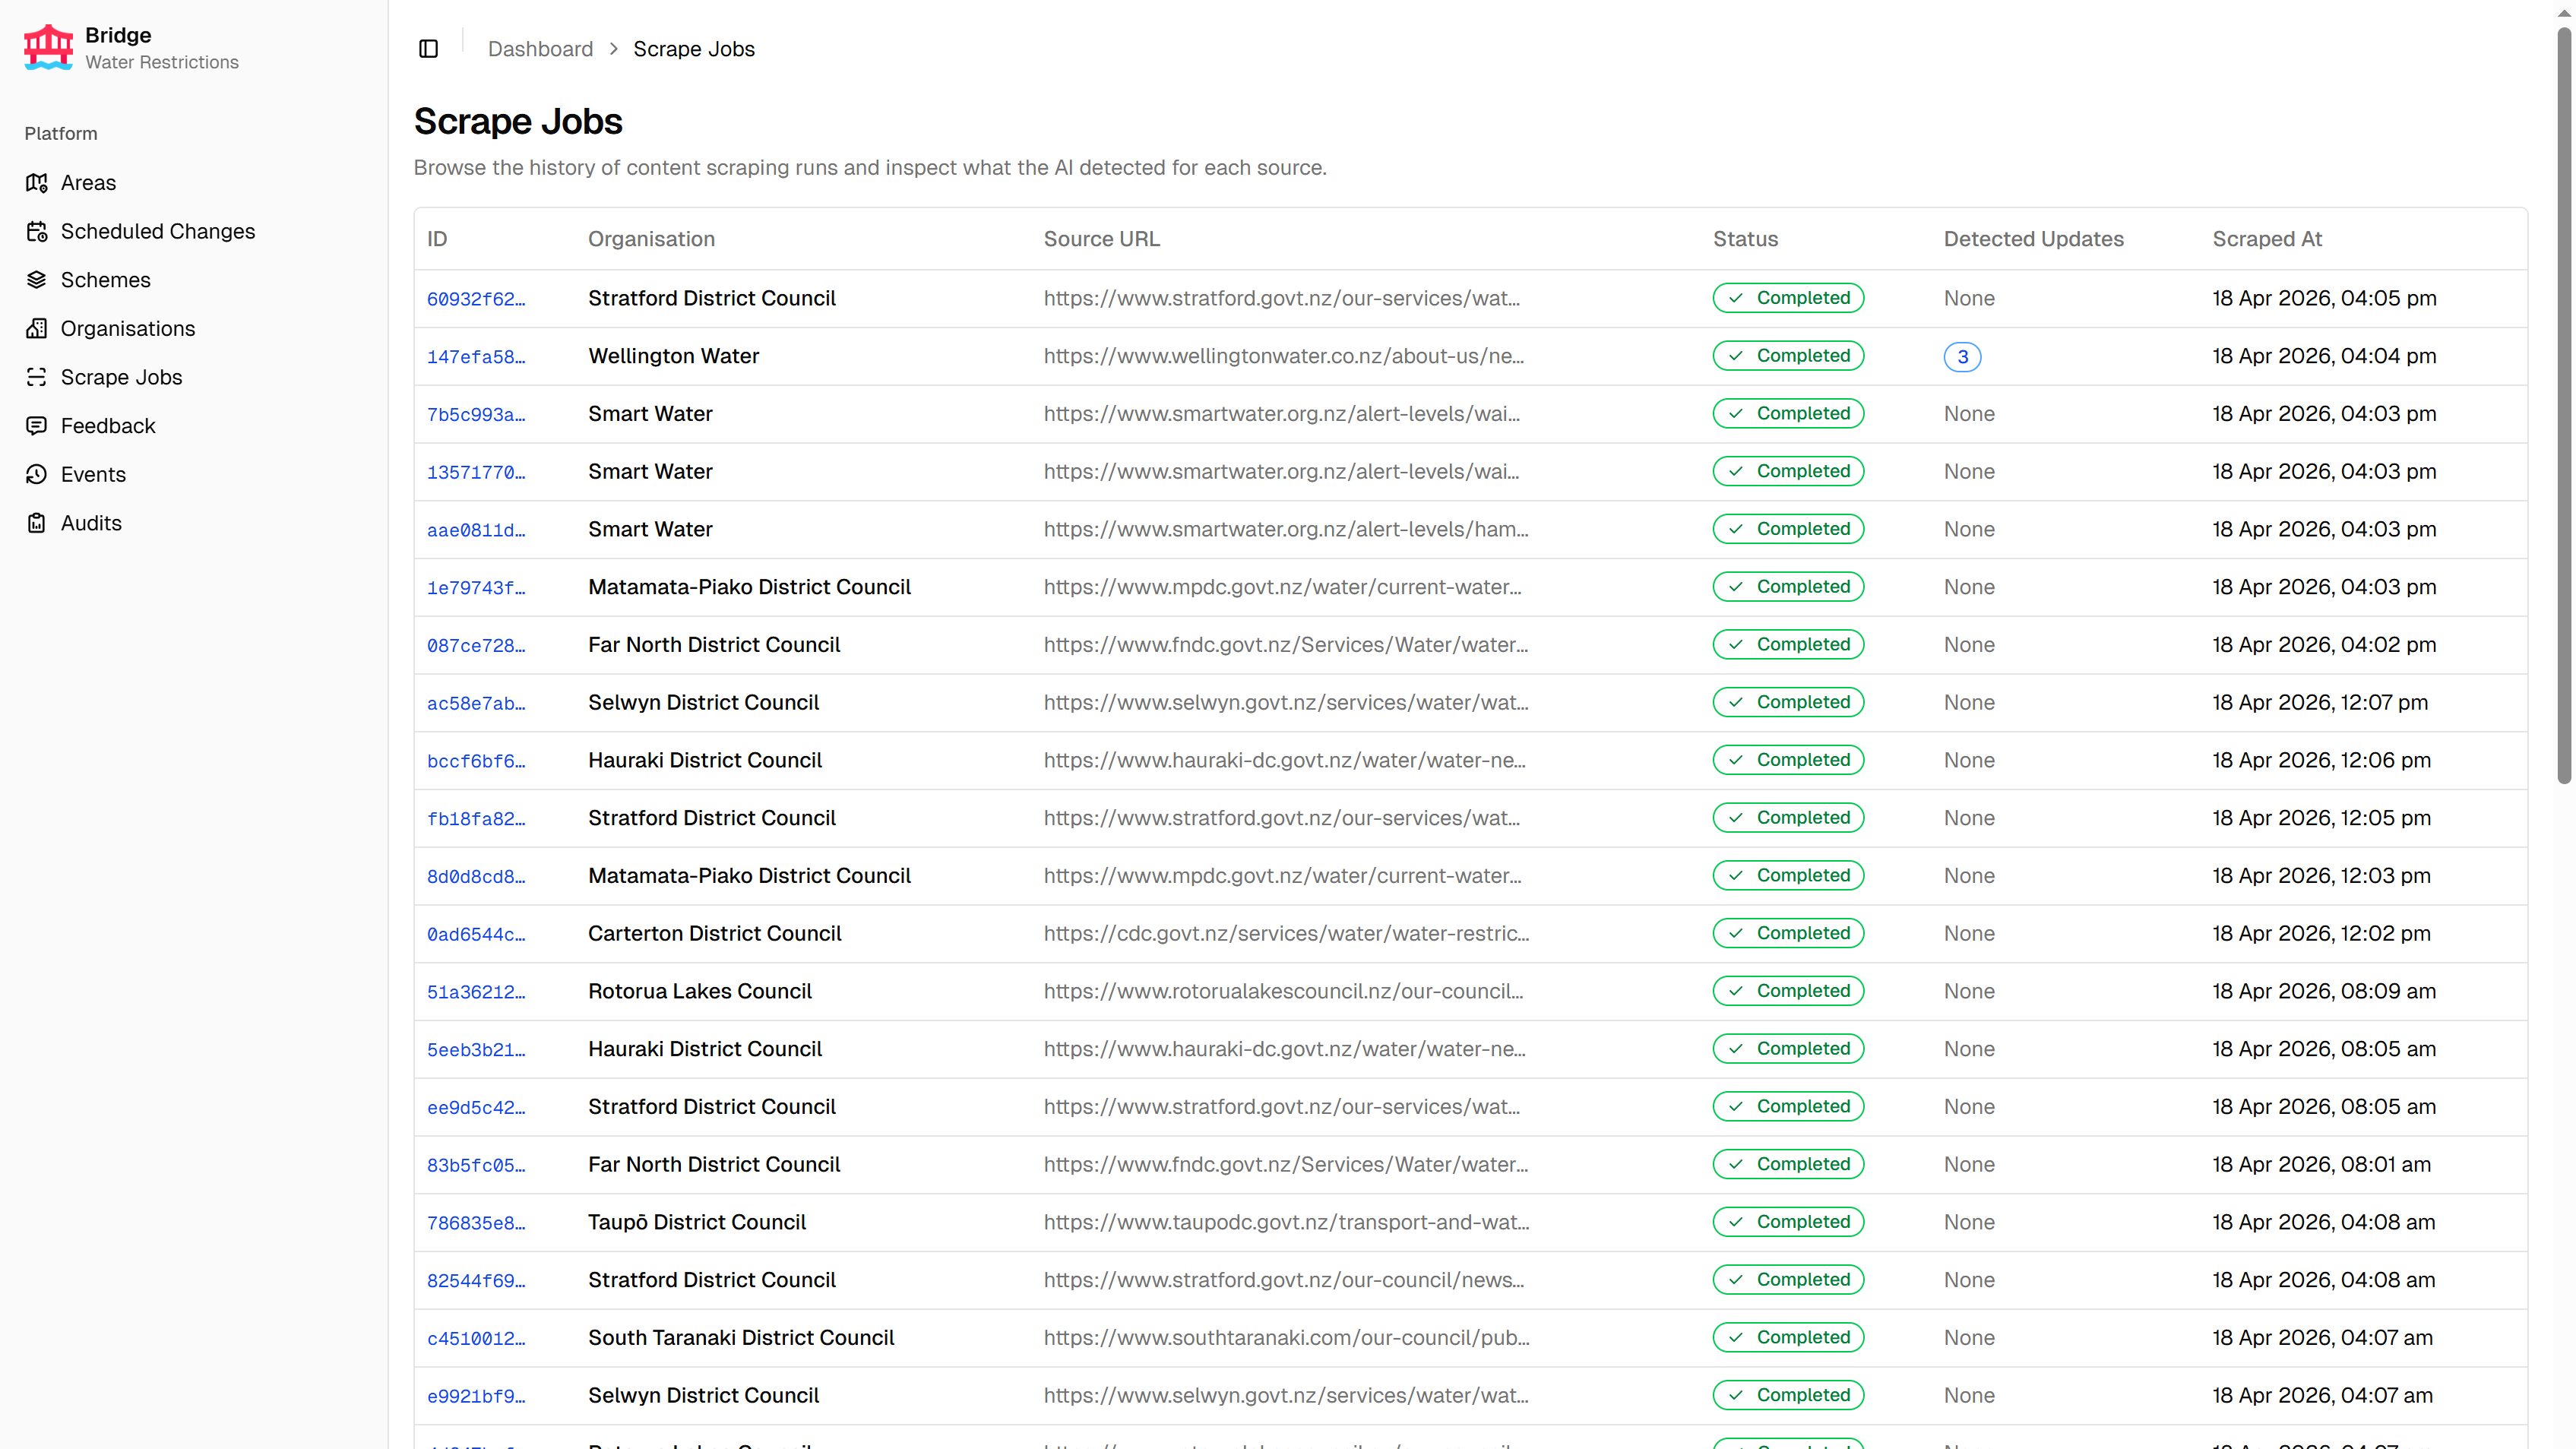
Each scrape run is recorded as a scrape job. The jobs list shows status across all organisations, with badges indicating each job’s outcome.
Data quality audits
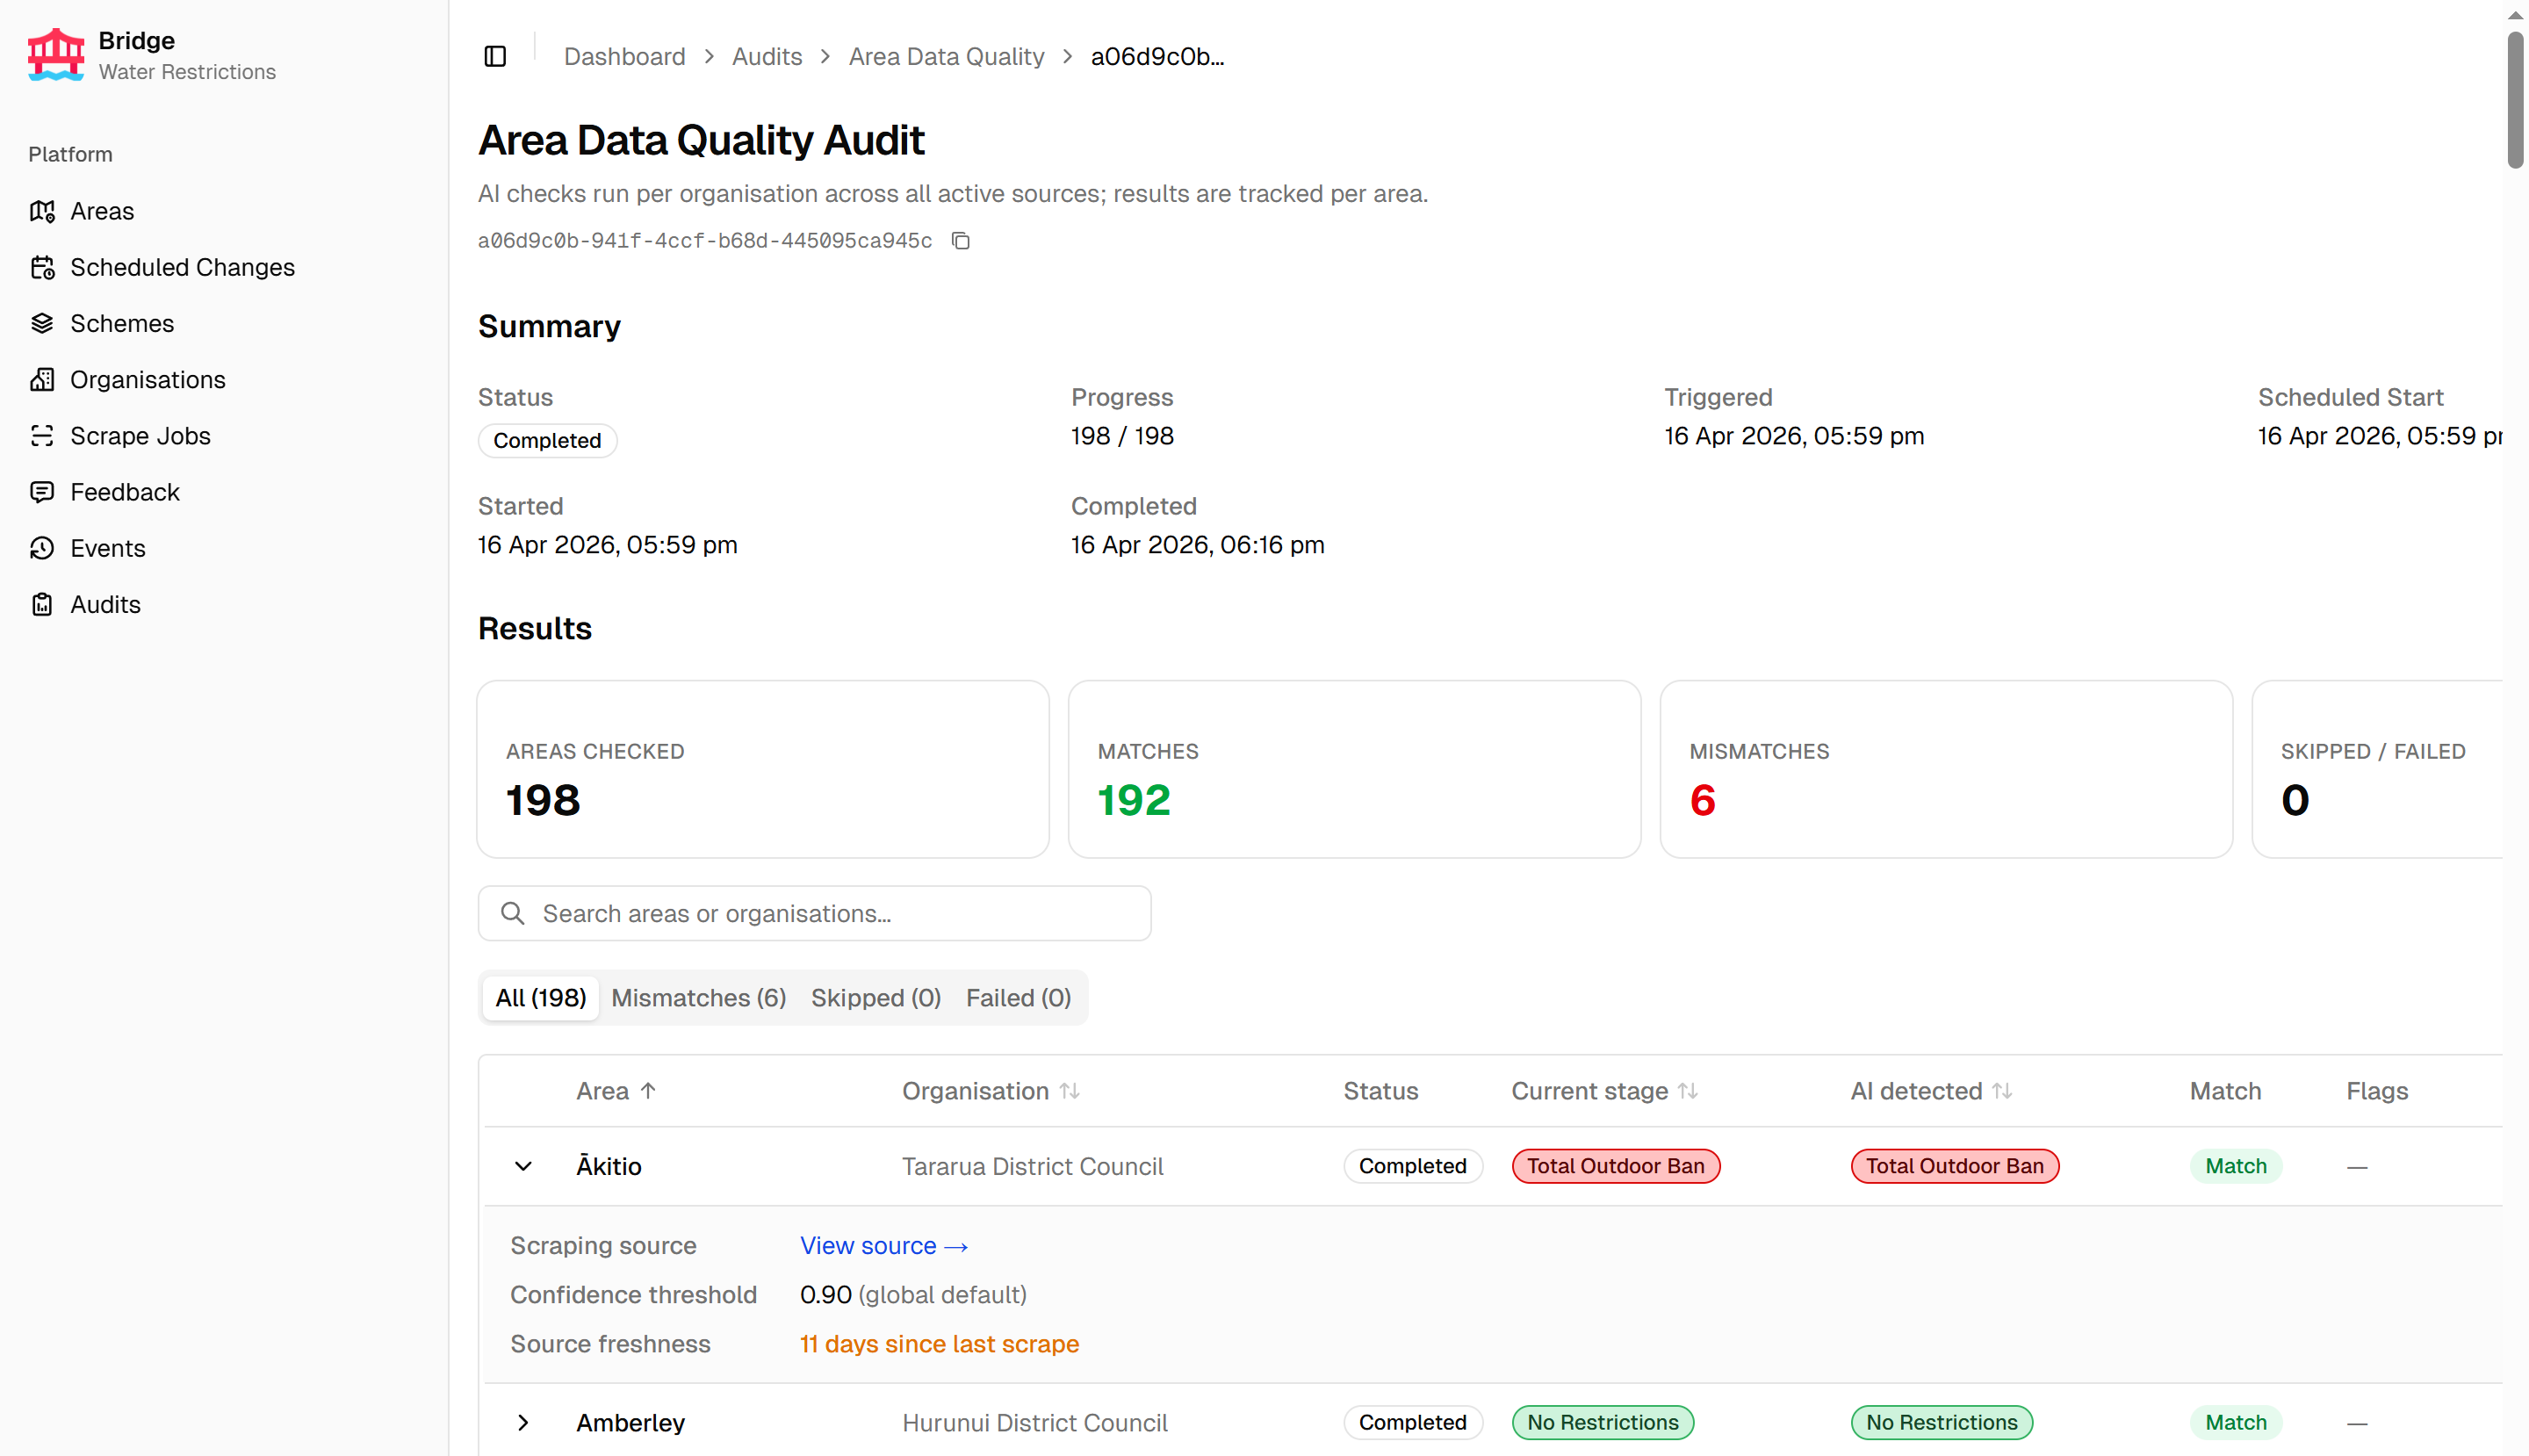
The Area Data Quality audit is triggered manually to check for drift between the API’s stored restriction data and what the scraping sources currently report. Results are tabbed by outcome, with severity mismatches surfaced in a dedicated tab. Each row expands to show the sources used and any quality flags raised.
Scheduled changes
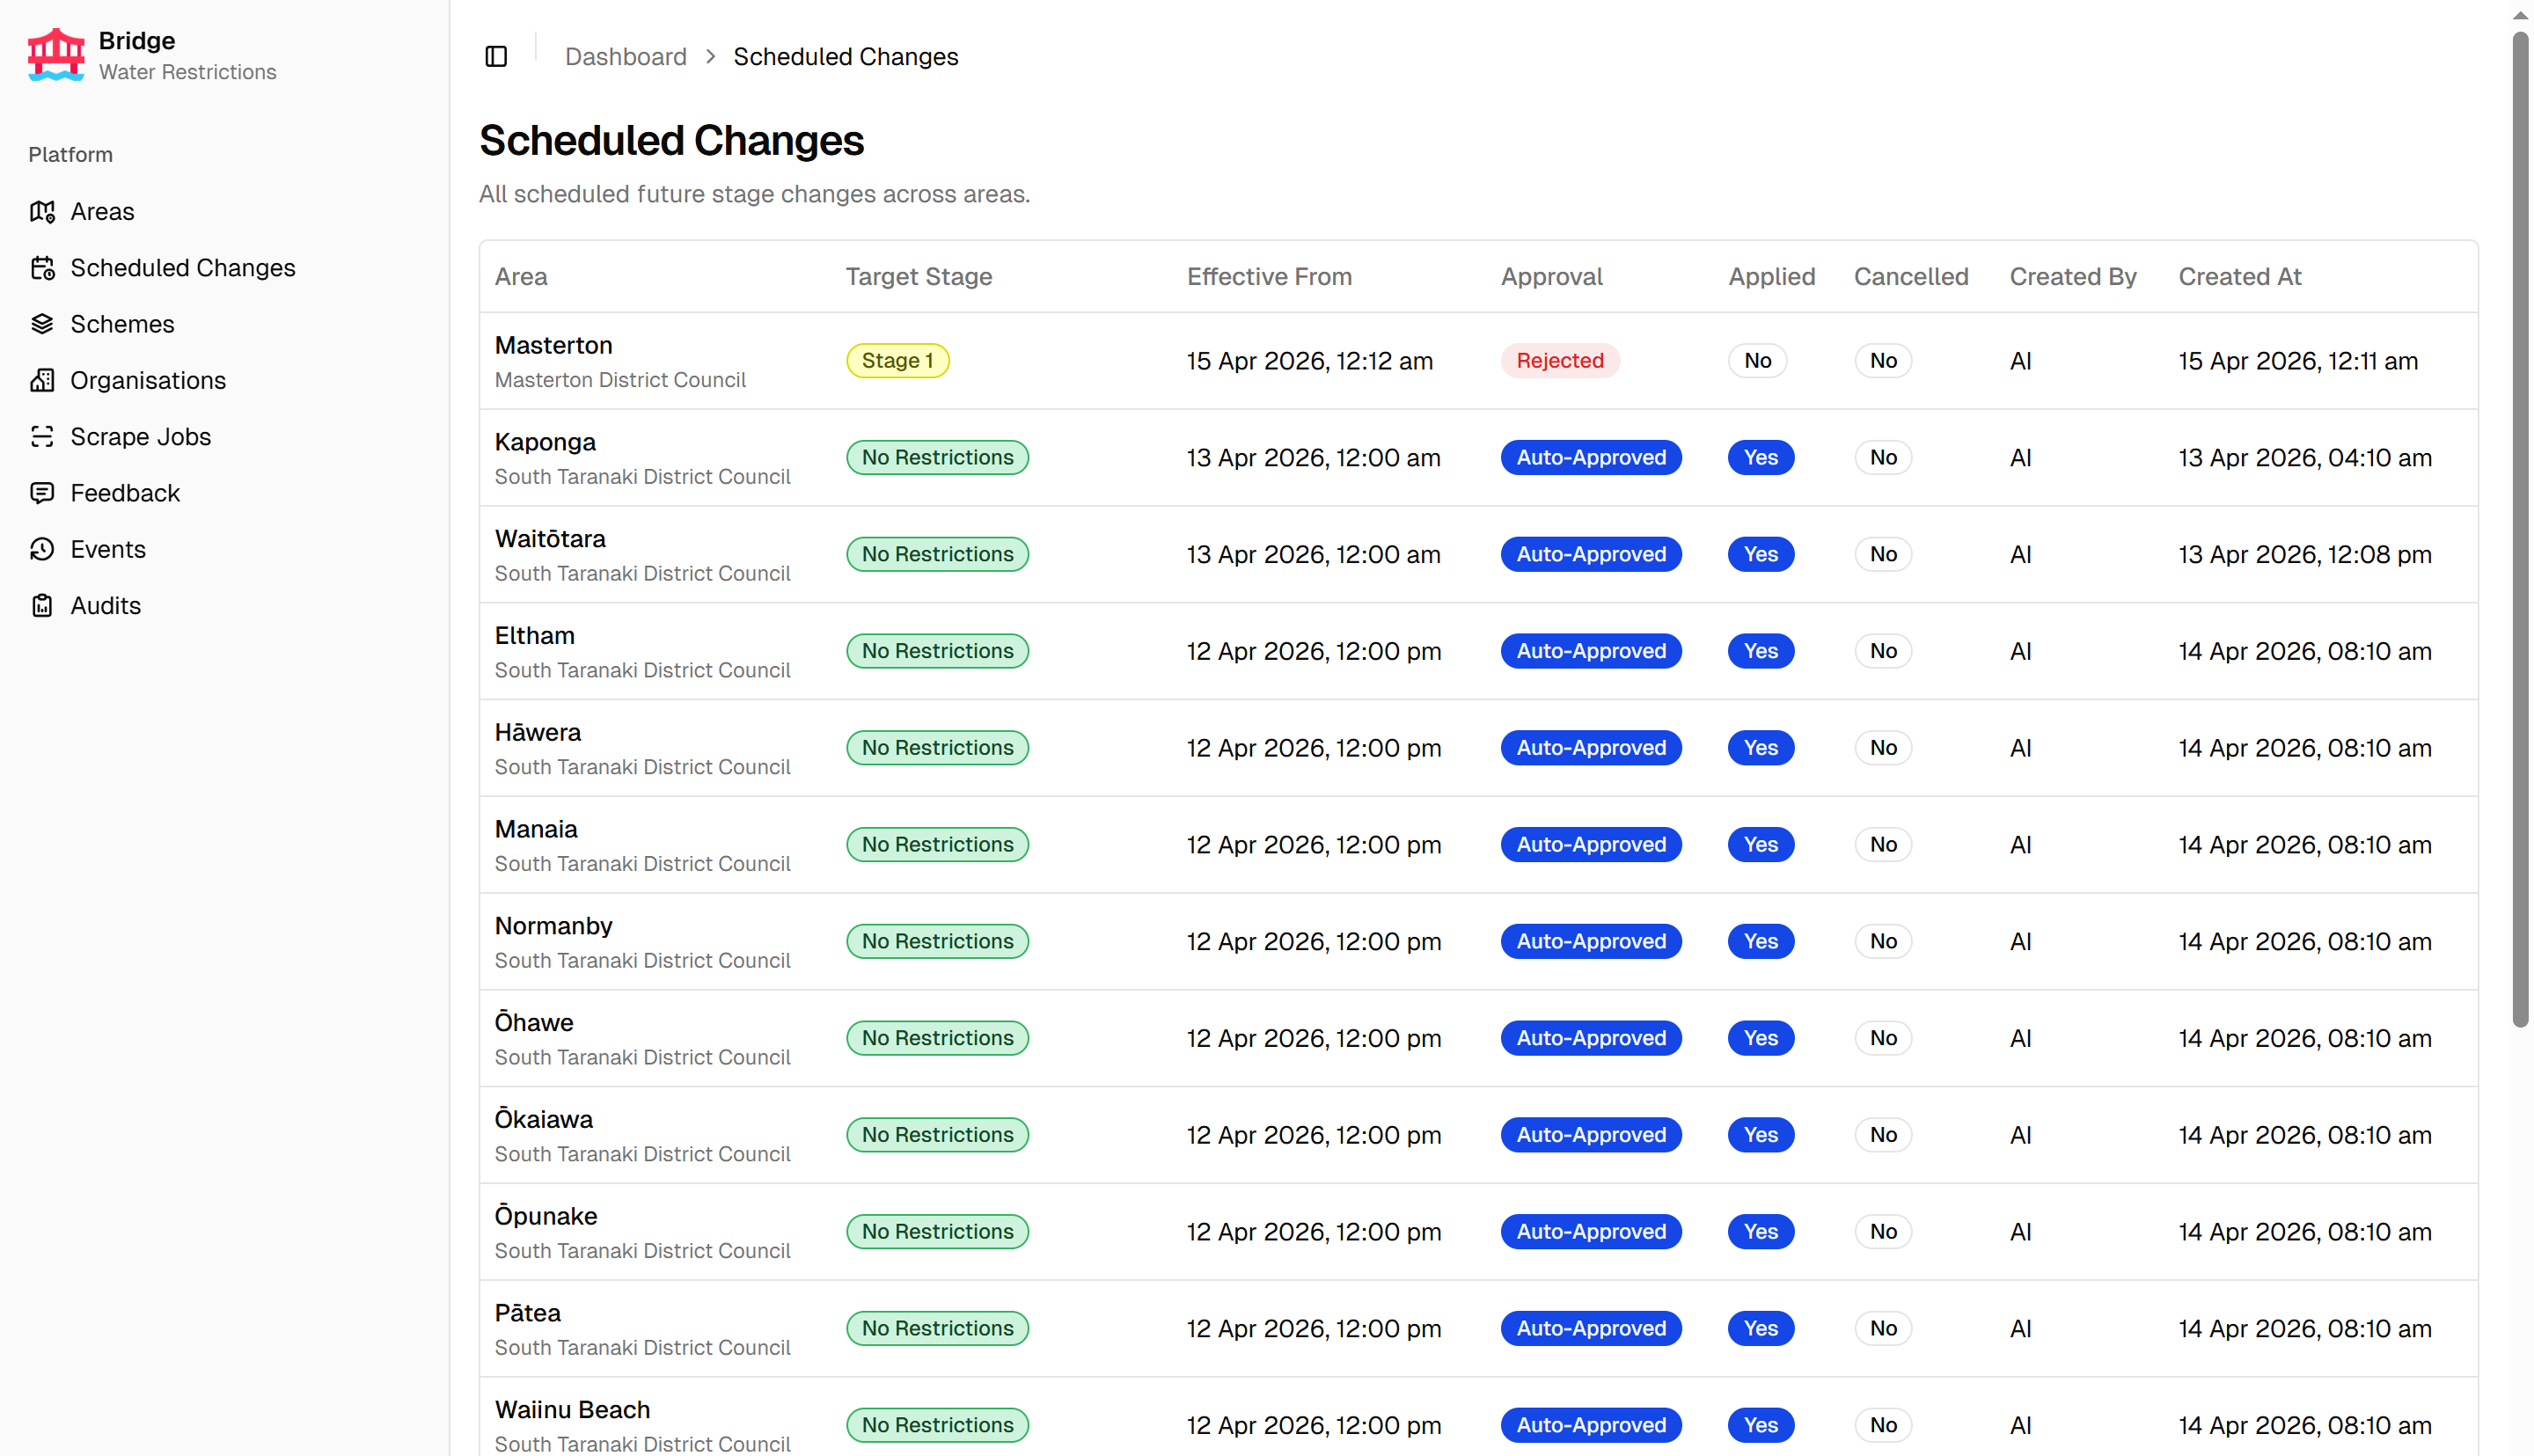
The scheduled changes page provides a global view of all planned stage changes across every area. Each entry shows the area, the target stage, the effective date, and current approval status. Scheduled changes can also be managed from the area detail page.
Feedback
Feedback submitted via the Water Restrictions Website surfaces in Bridge for review, giving users a direct channel to report incorrect restriction data.
Stack
This project uses my standard stack setup.
- Frontend: Next.js 16, React 19, TypeScript, Tailwind CSS, shadcn/ui, TanStack Table, Recharts, Leaflet, Monaco Editor
- Backend: next-auth v5 (authentication), AWS Cognito (identity provider)
- Observability: OpenTelemetry, Pino → Grafana Cloud
- Infrastructure: Cloudflare Access, DigitalOcean App Platform, Terraform, GitHub Actions