Water restriction information across New Zealand is spread across council and water entity websites, each with a different format and structure. The Water Restrictions Website provides a single point of access: an interactive map colour-coded by severity, area overview pages covering current rules, restriction history, and any known future changes. It also hosts the documentation for the Water Restrictions API that powers it.
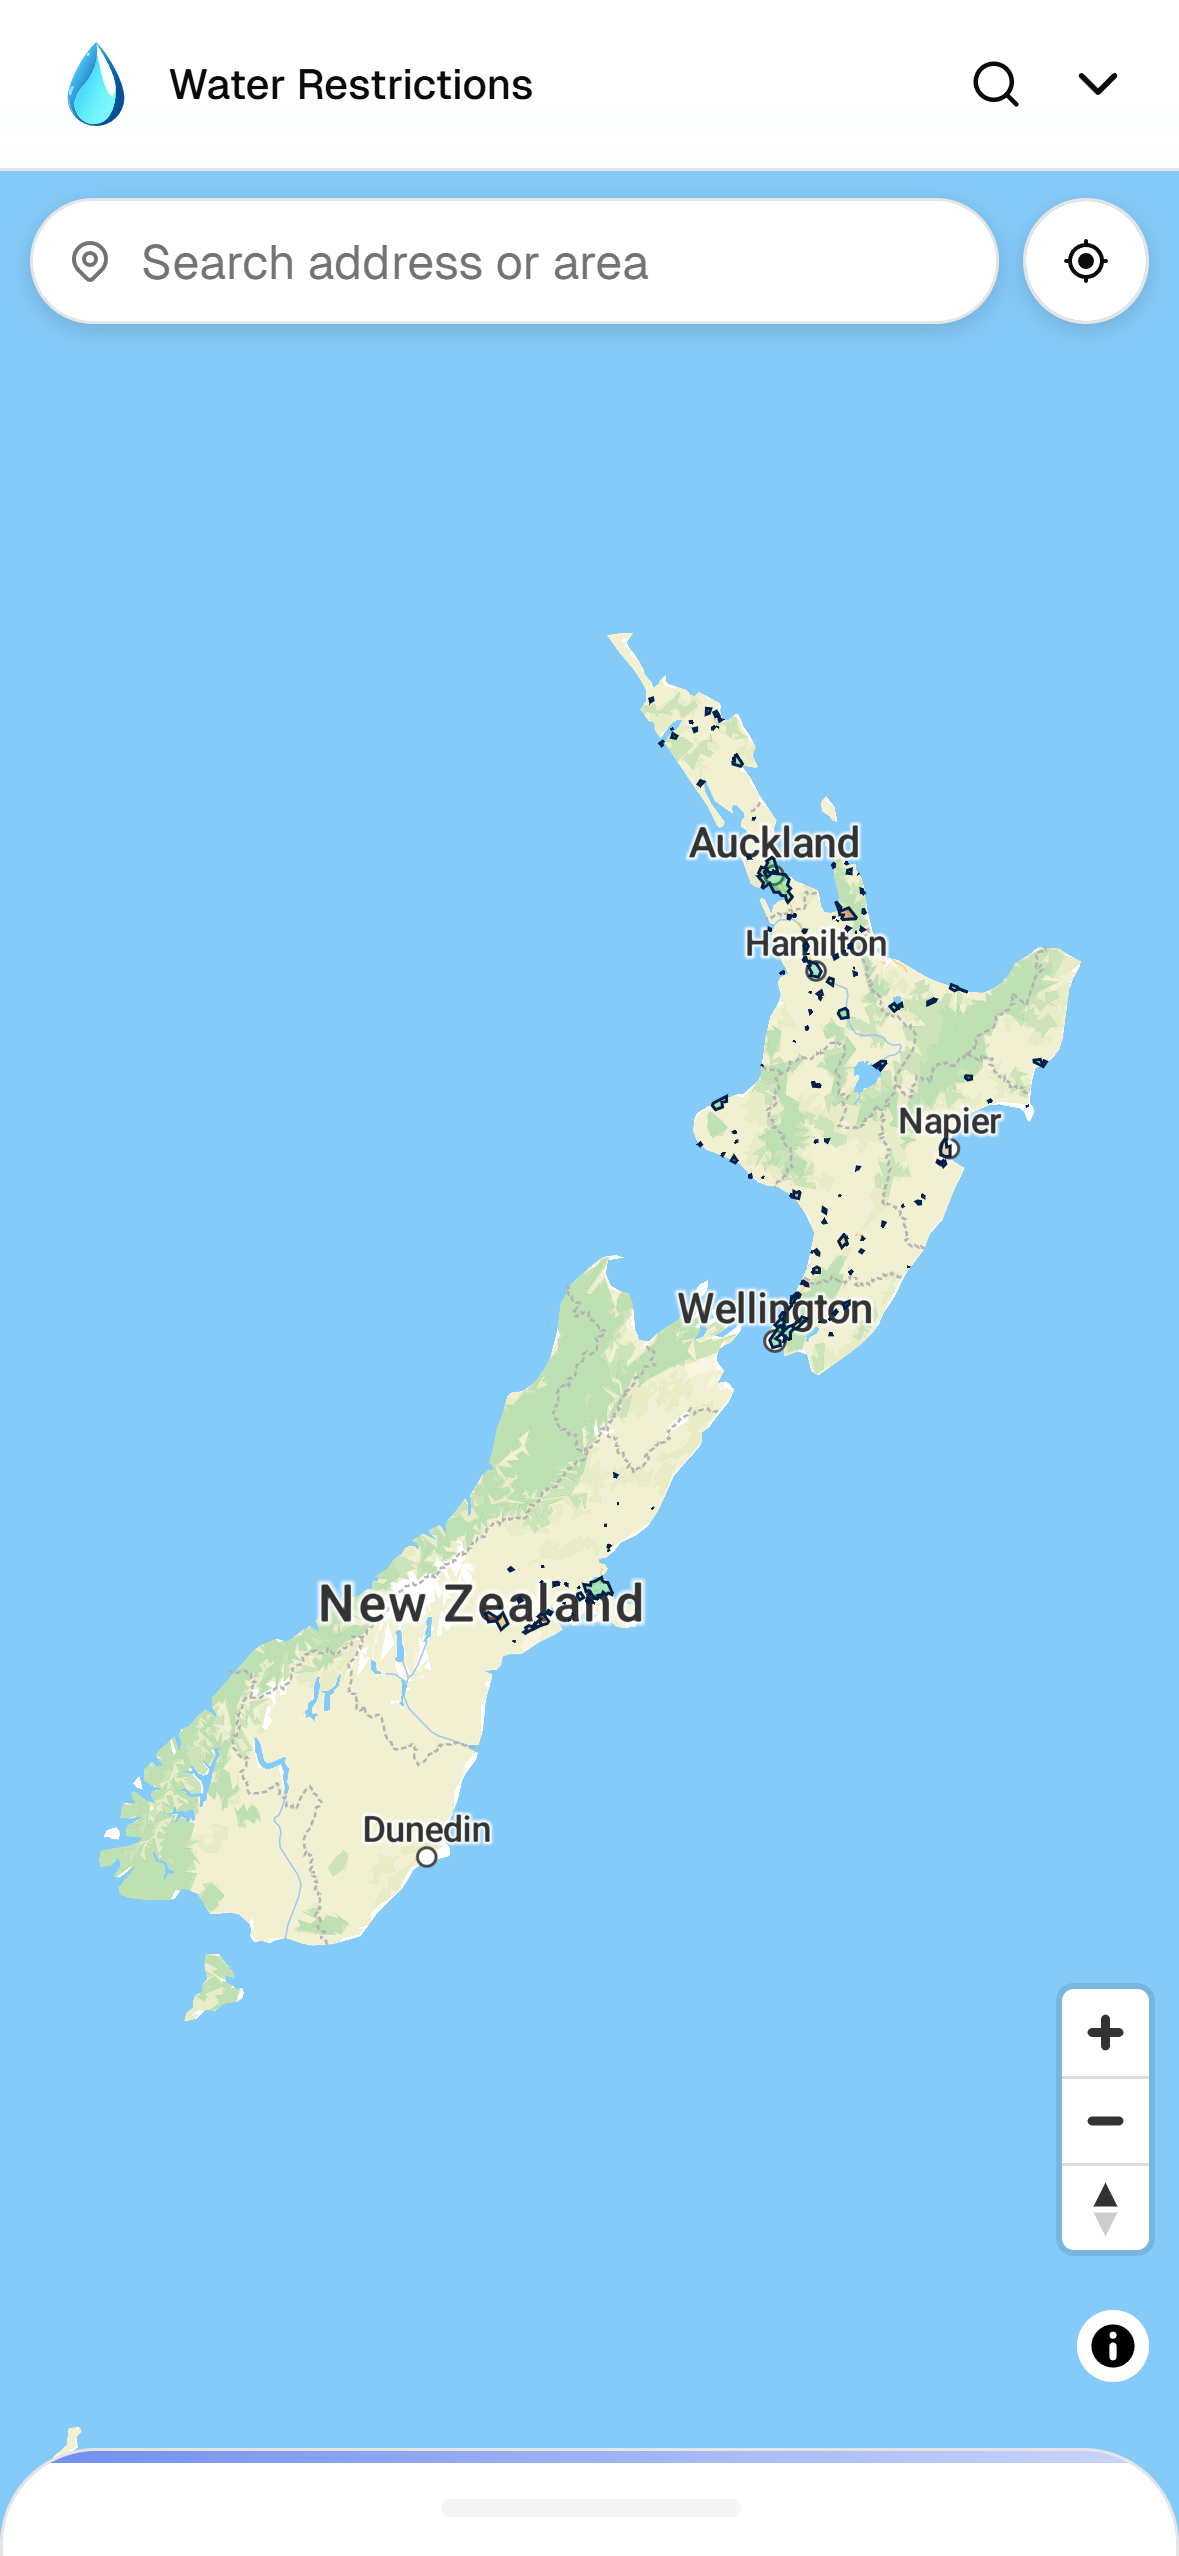
Any data set or detected by the automated pipeline is marked with an AI attribution badge or sparkle icon.
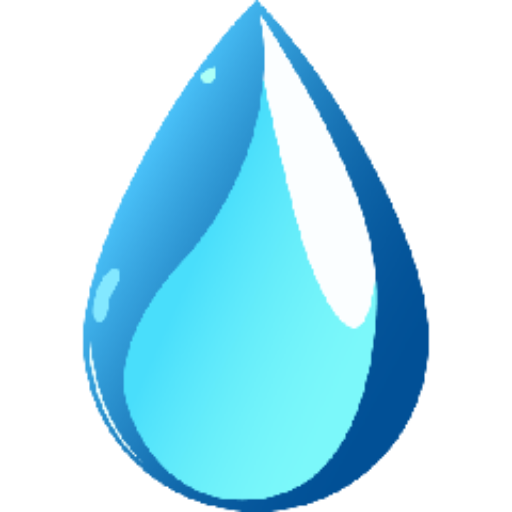
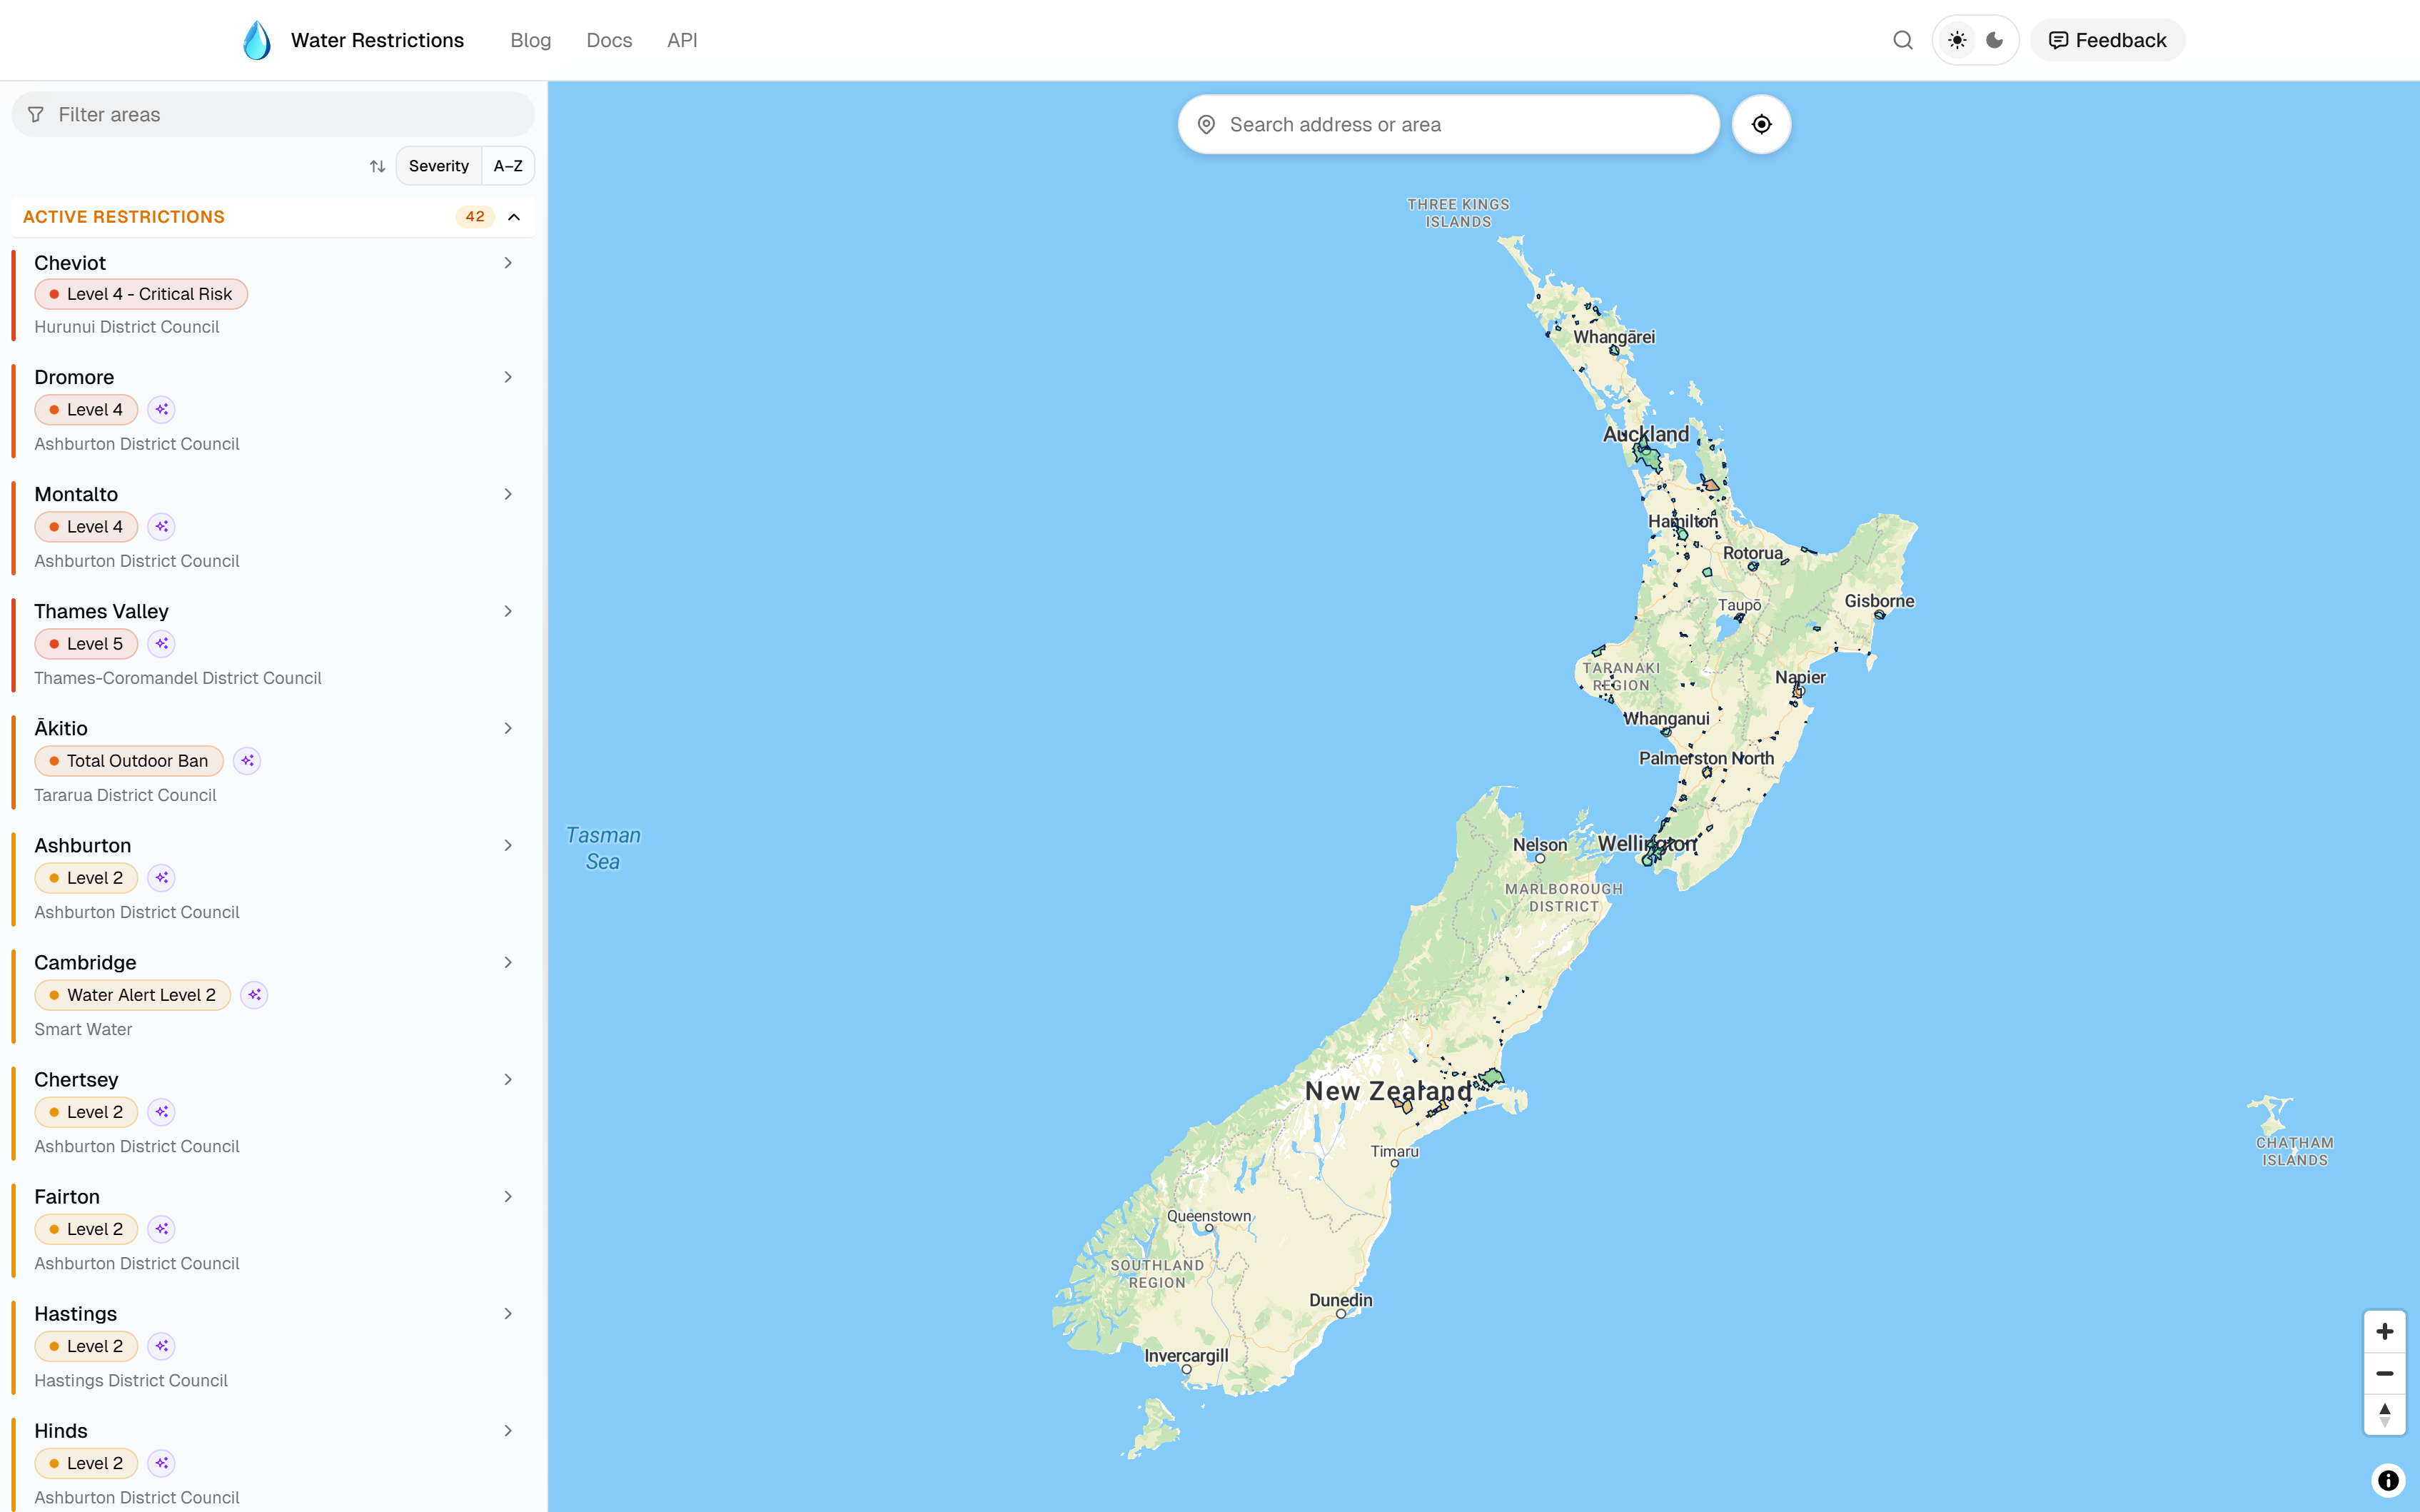
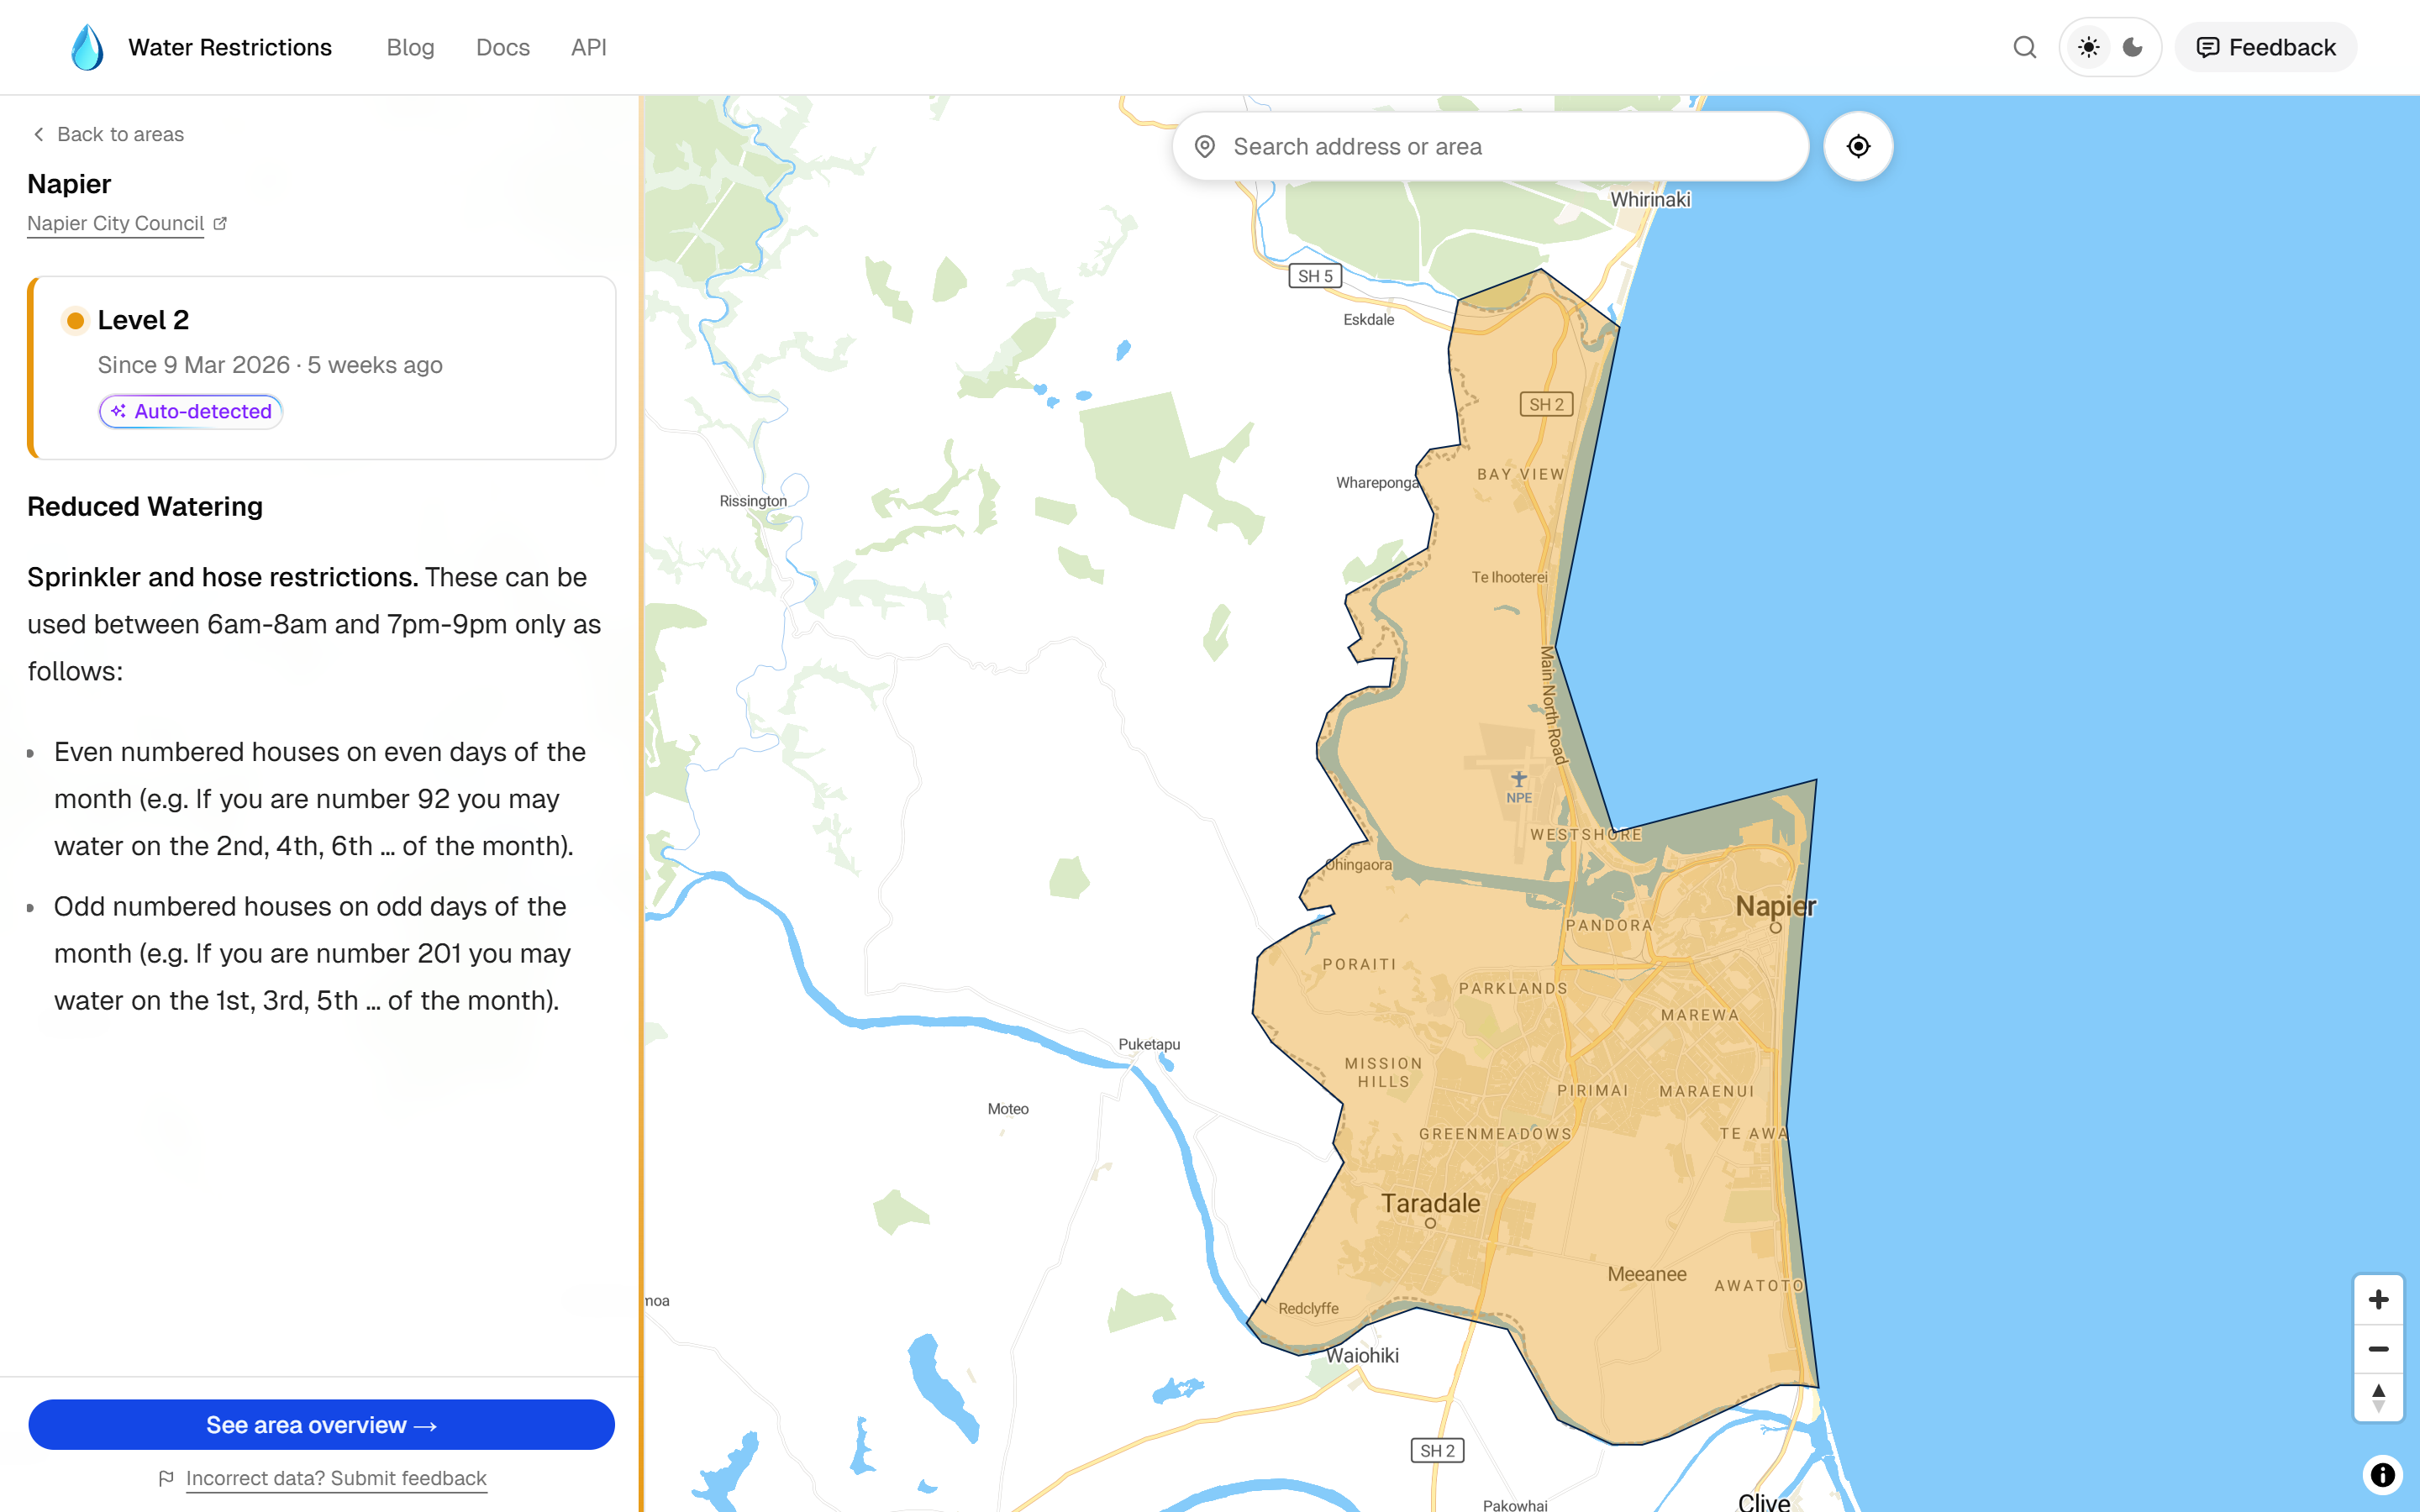
Interactive map
The map is the main entry point. Areas are colour-coded by severity, showing which parts of the country are under restrictions. The map stays mounted across page navigation, so browsing area overview pages doesn’t cause a full reload.
The area boundaries are sourced from Stats NZ and LINZ Data Service. Boundary data was simplified in QGIS to reduce file sizes while preserving useful accuracy.
A search bar lets users find areas by place name using MapTiler geocoding, with a “locate me” button that jumps to the user’s current location.
API responses are cached server-side with a 30-minute TTL. Water restriction data changes infrequently, so a short staleness window is an acceptable trade-off for reduced API load.
Area list
An area list panel lets users browse and filter all areas without relying on the map. On desktop it appears as a sidebar; on mobile it opens as a bottom drawer.
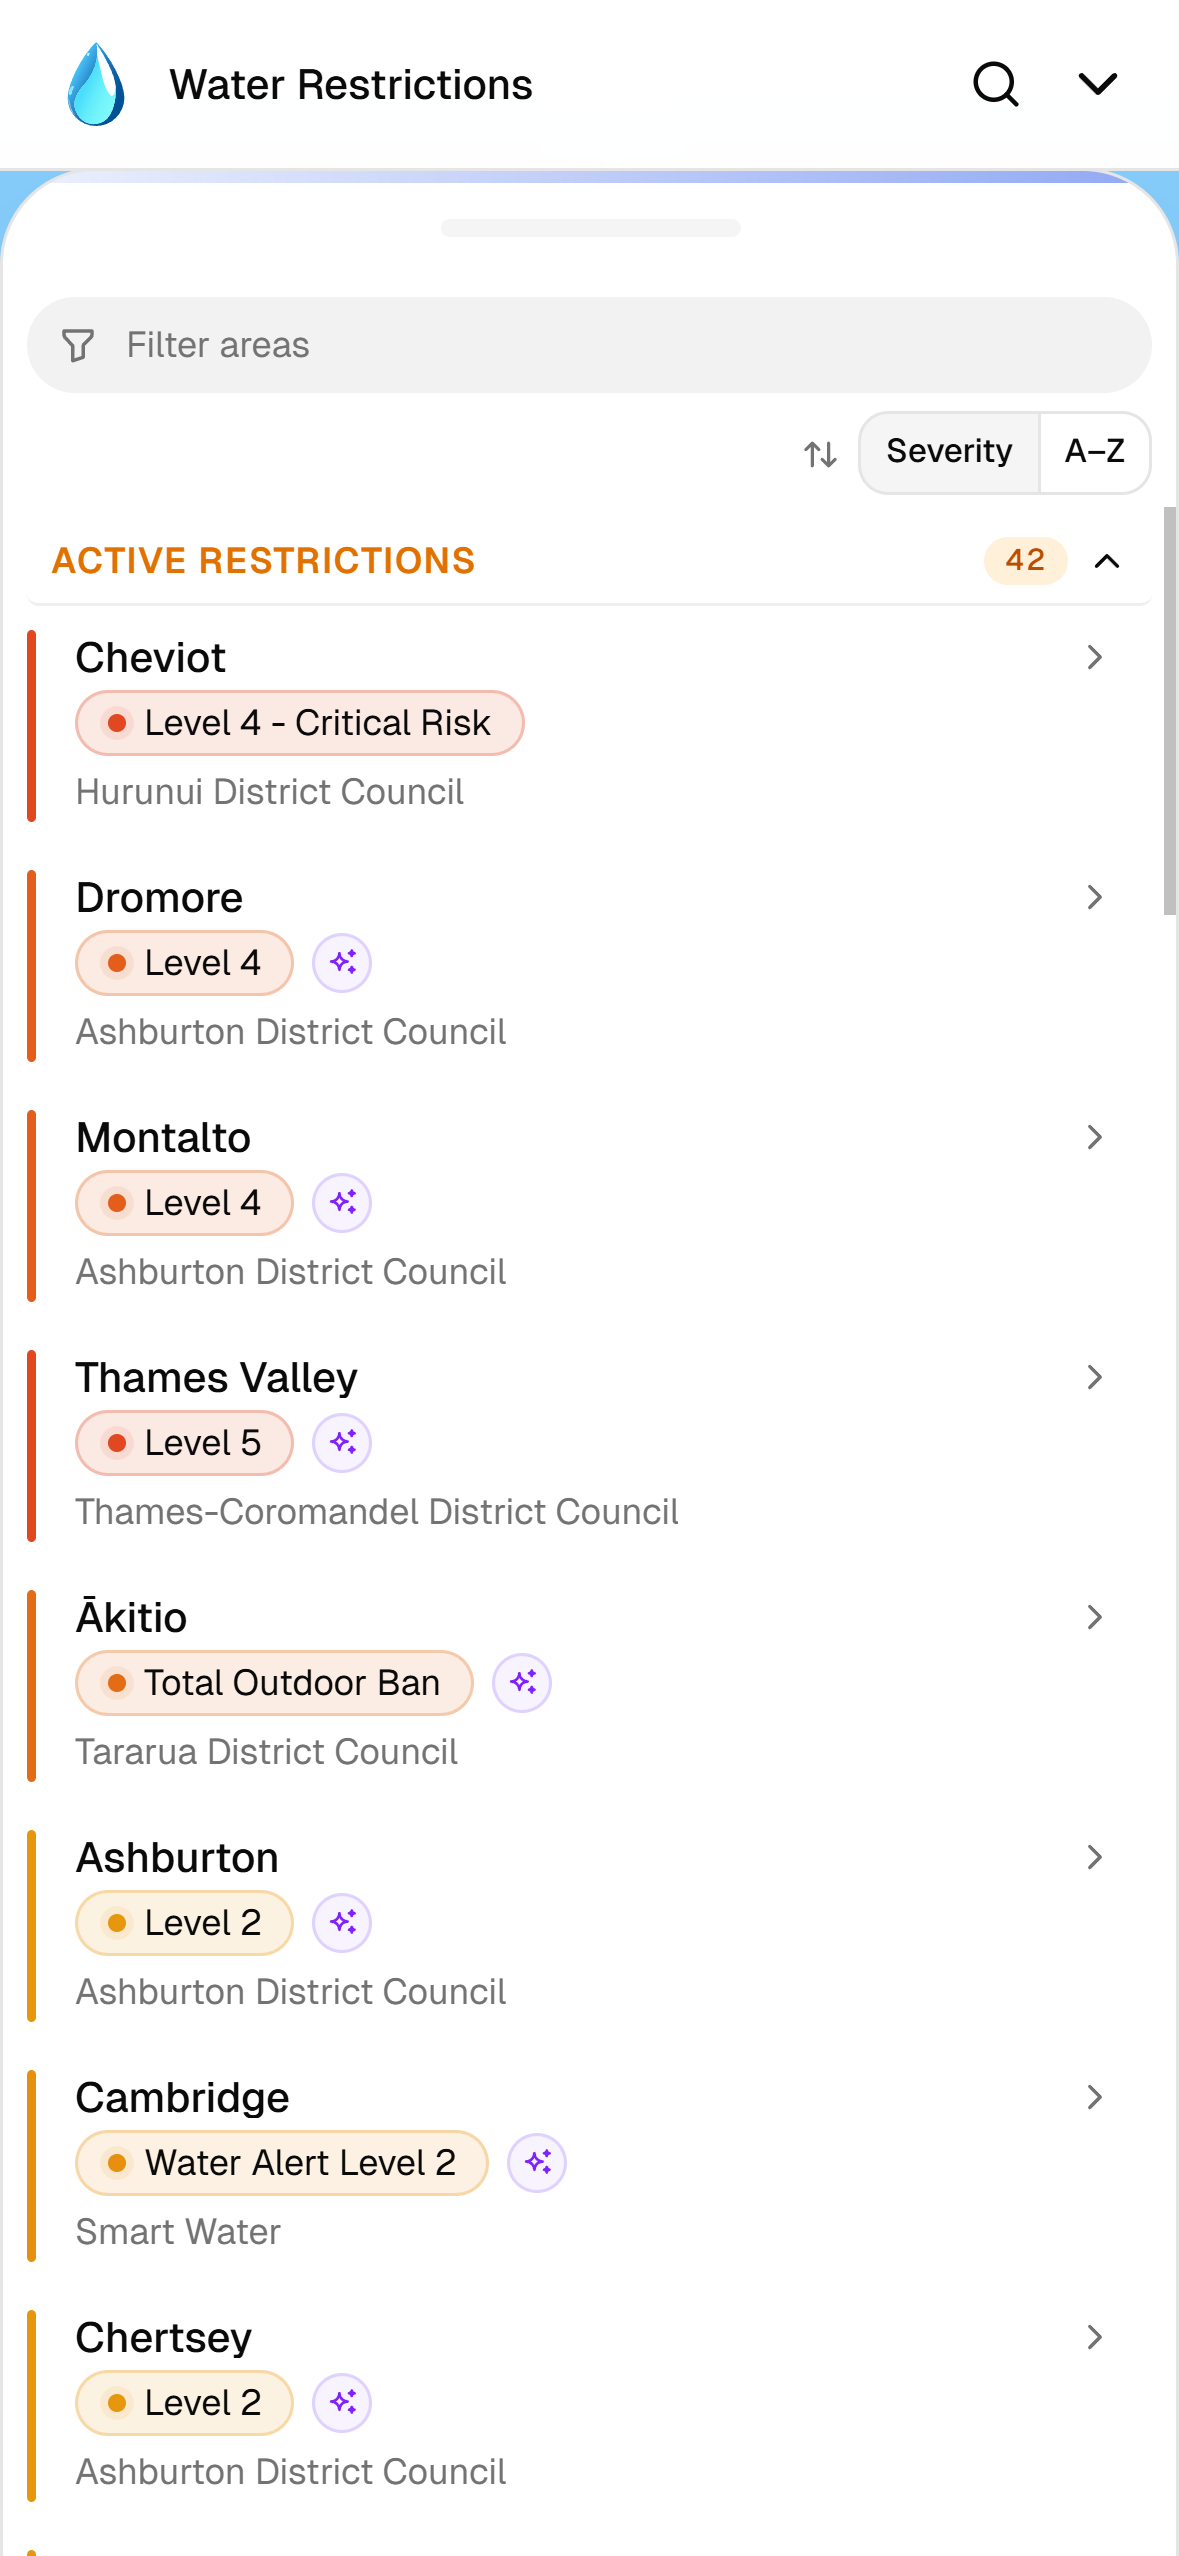
Areas can be filtered by name and sorted by restriction severity or alphabetically. Filtering is accent-insensitive — for example, searching for “Hawera” also matches “Hāwera”. Areas with active restrictions are grouped separately from those with no current restrictions.
Selecting an area shows a summary of its current restriction stage and zooms to its location on the map; on mobile, the drawer stays expanded.
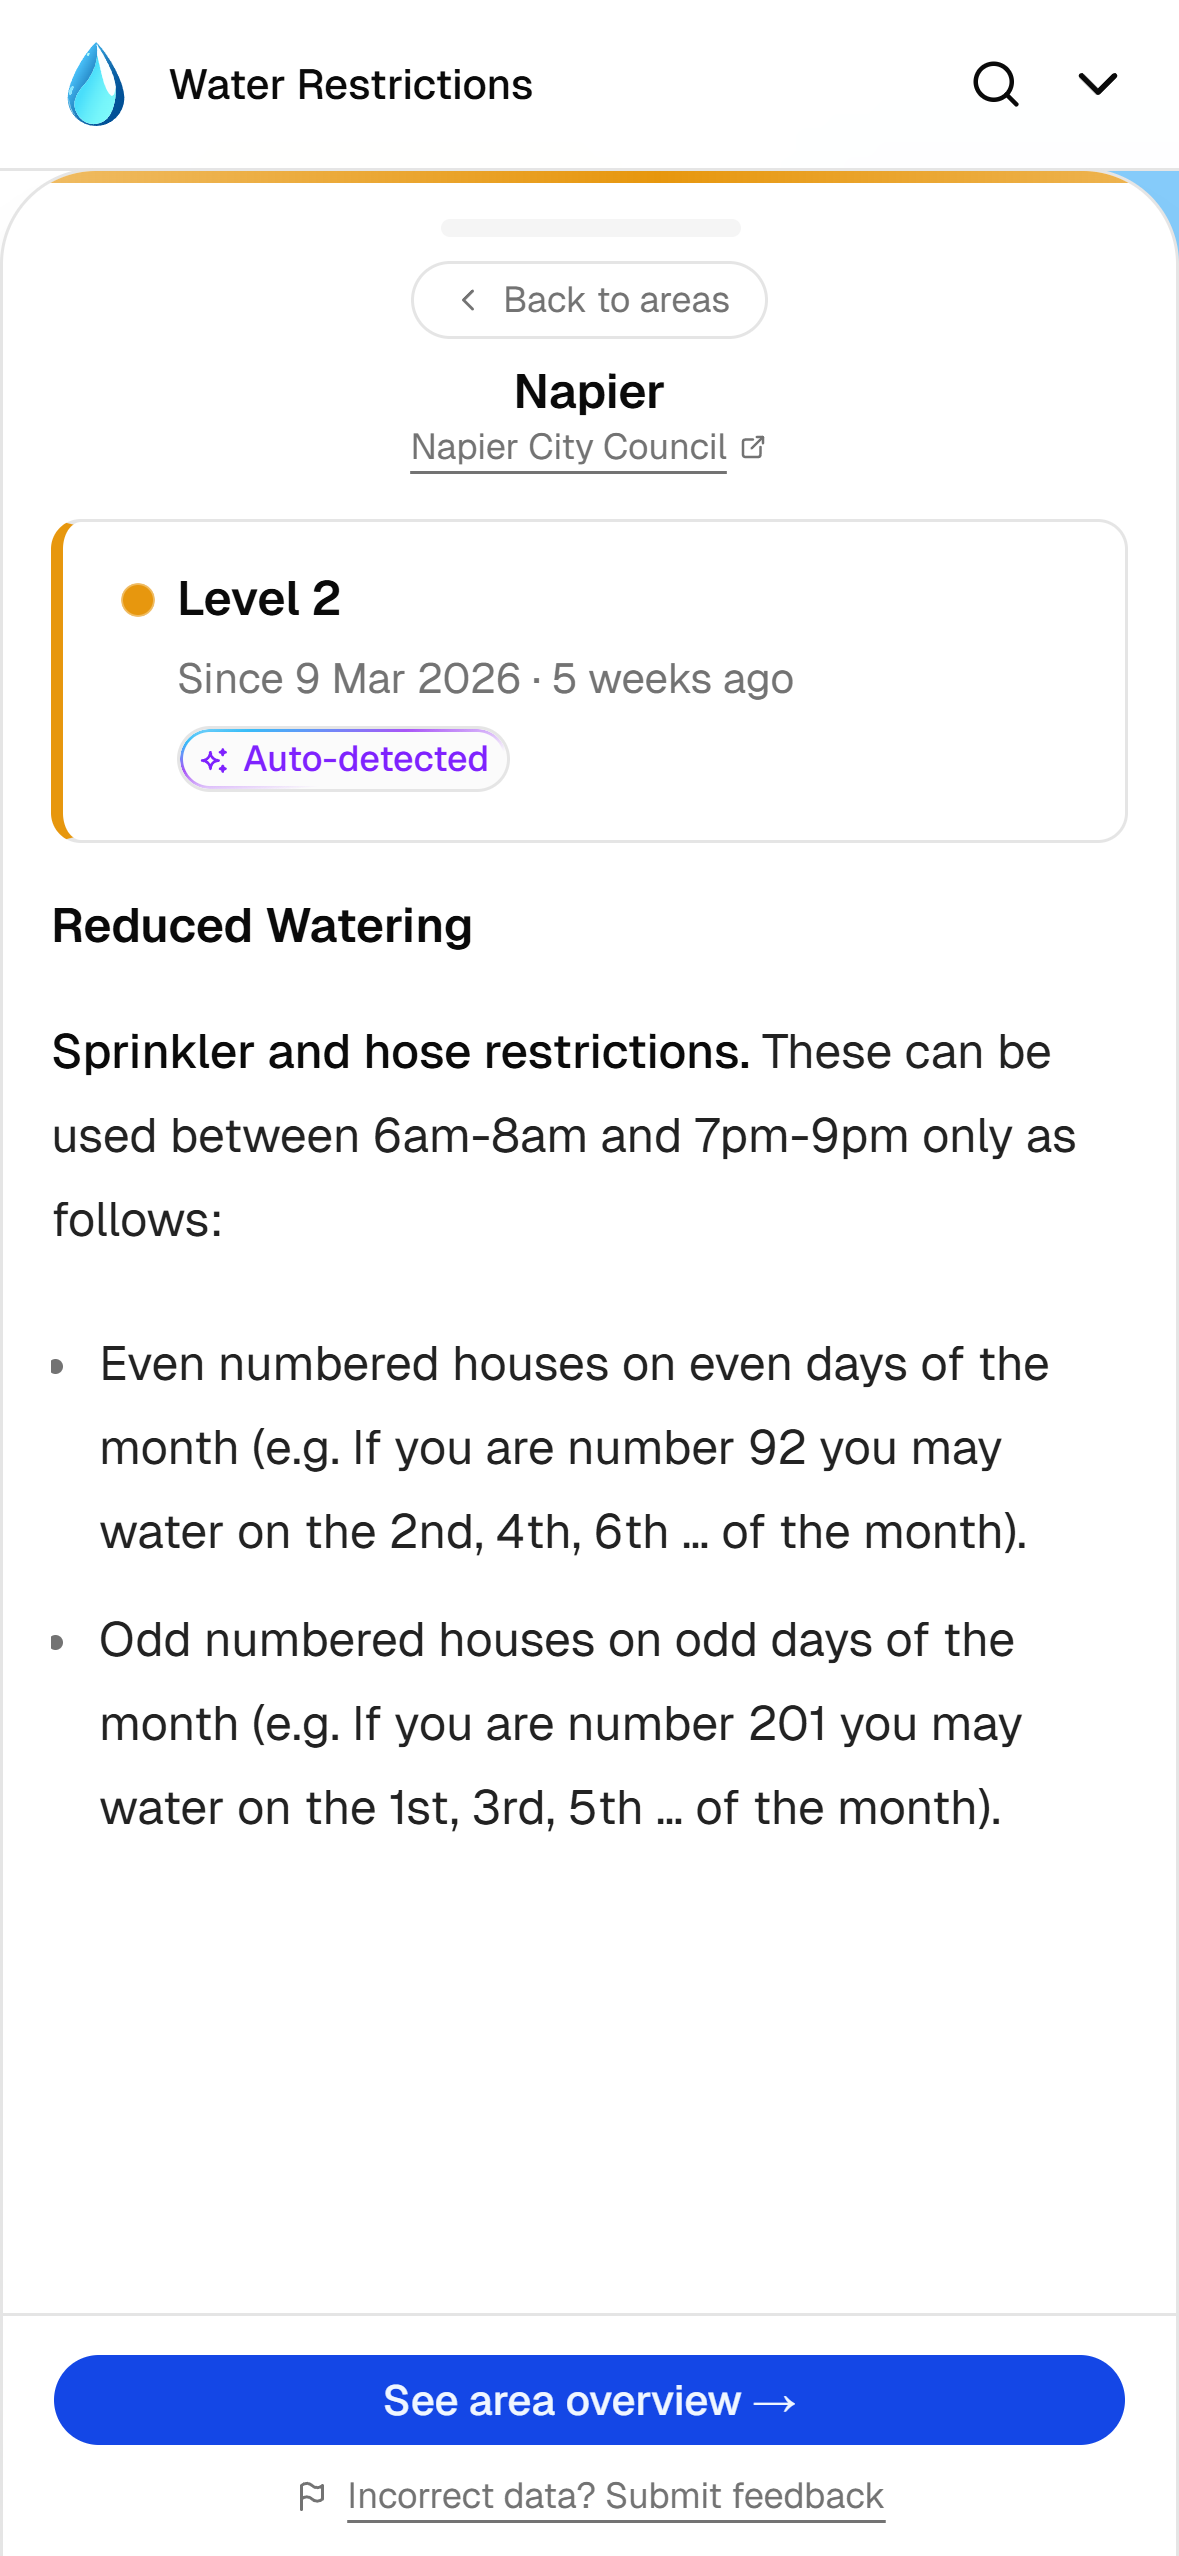
A “See area overview” button opens the full detail page for that area.
Area overview
Each area has a dedicated page at /areas/[id] showing the current restriction stage, the applicable rules, any upcoming scheduled changes, and a list of the data sources the Water Restrictions API monitors for that area.
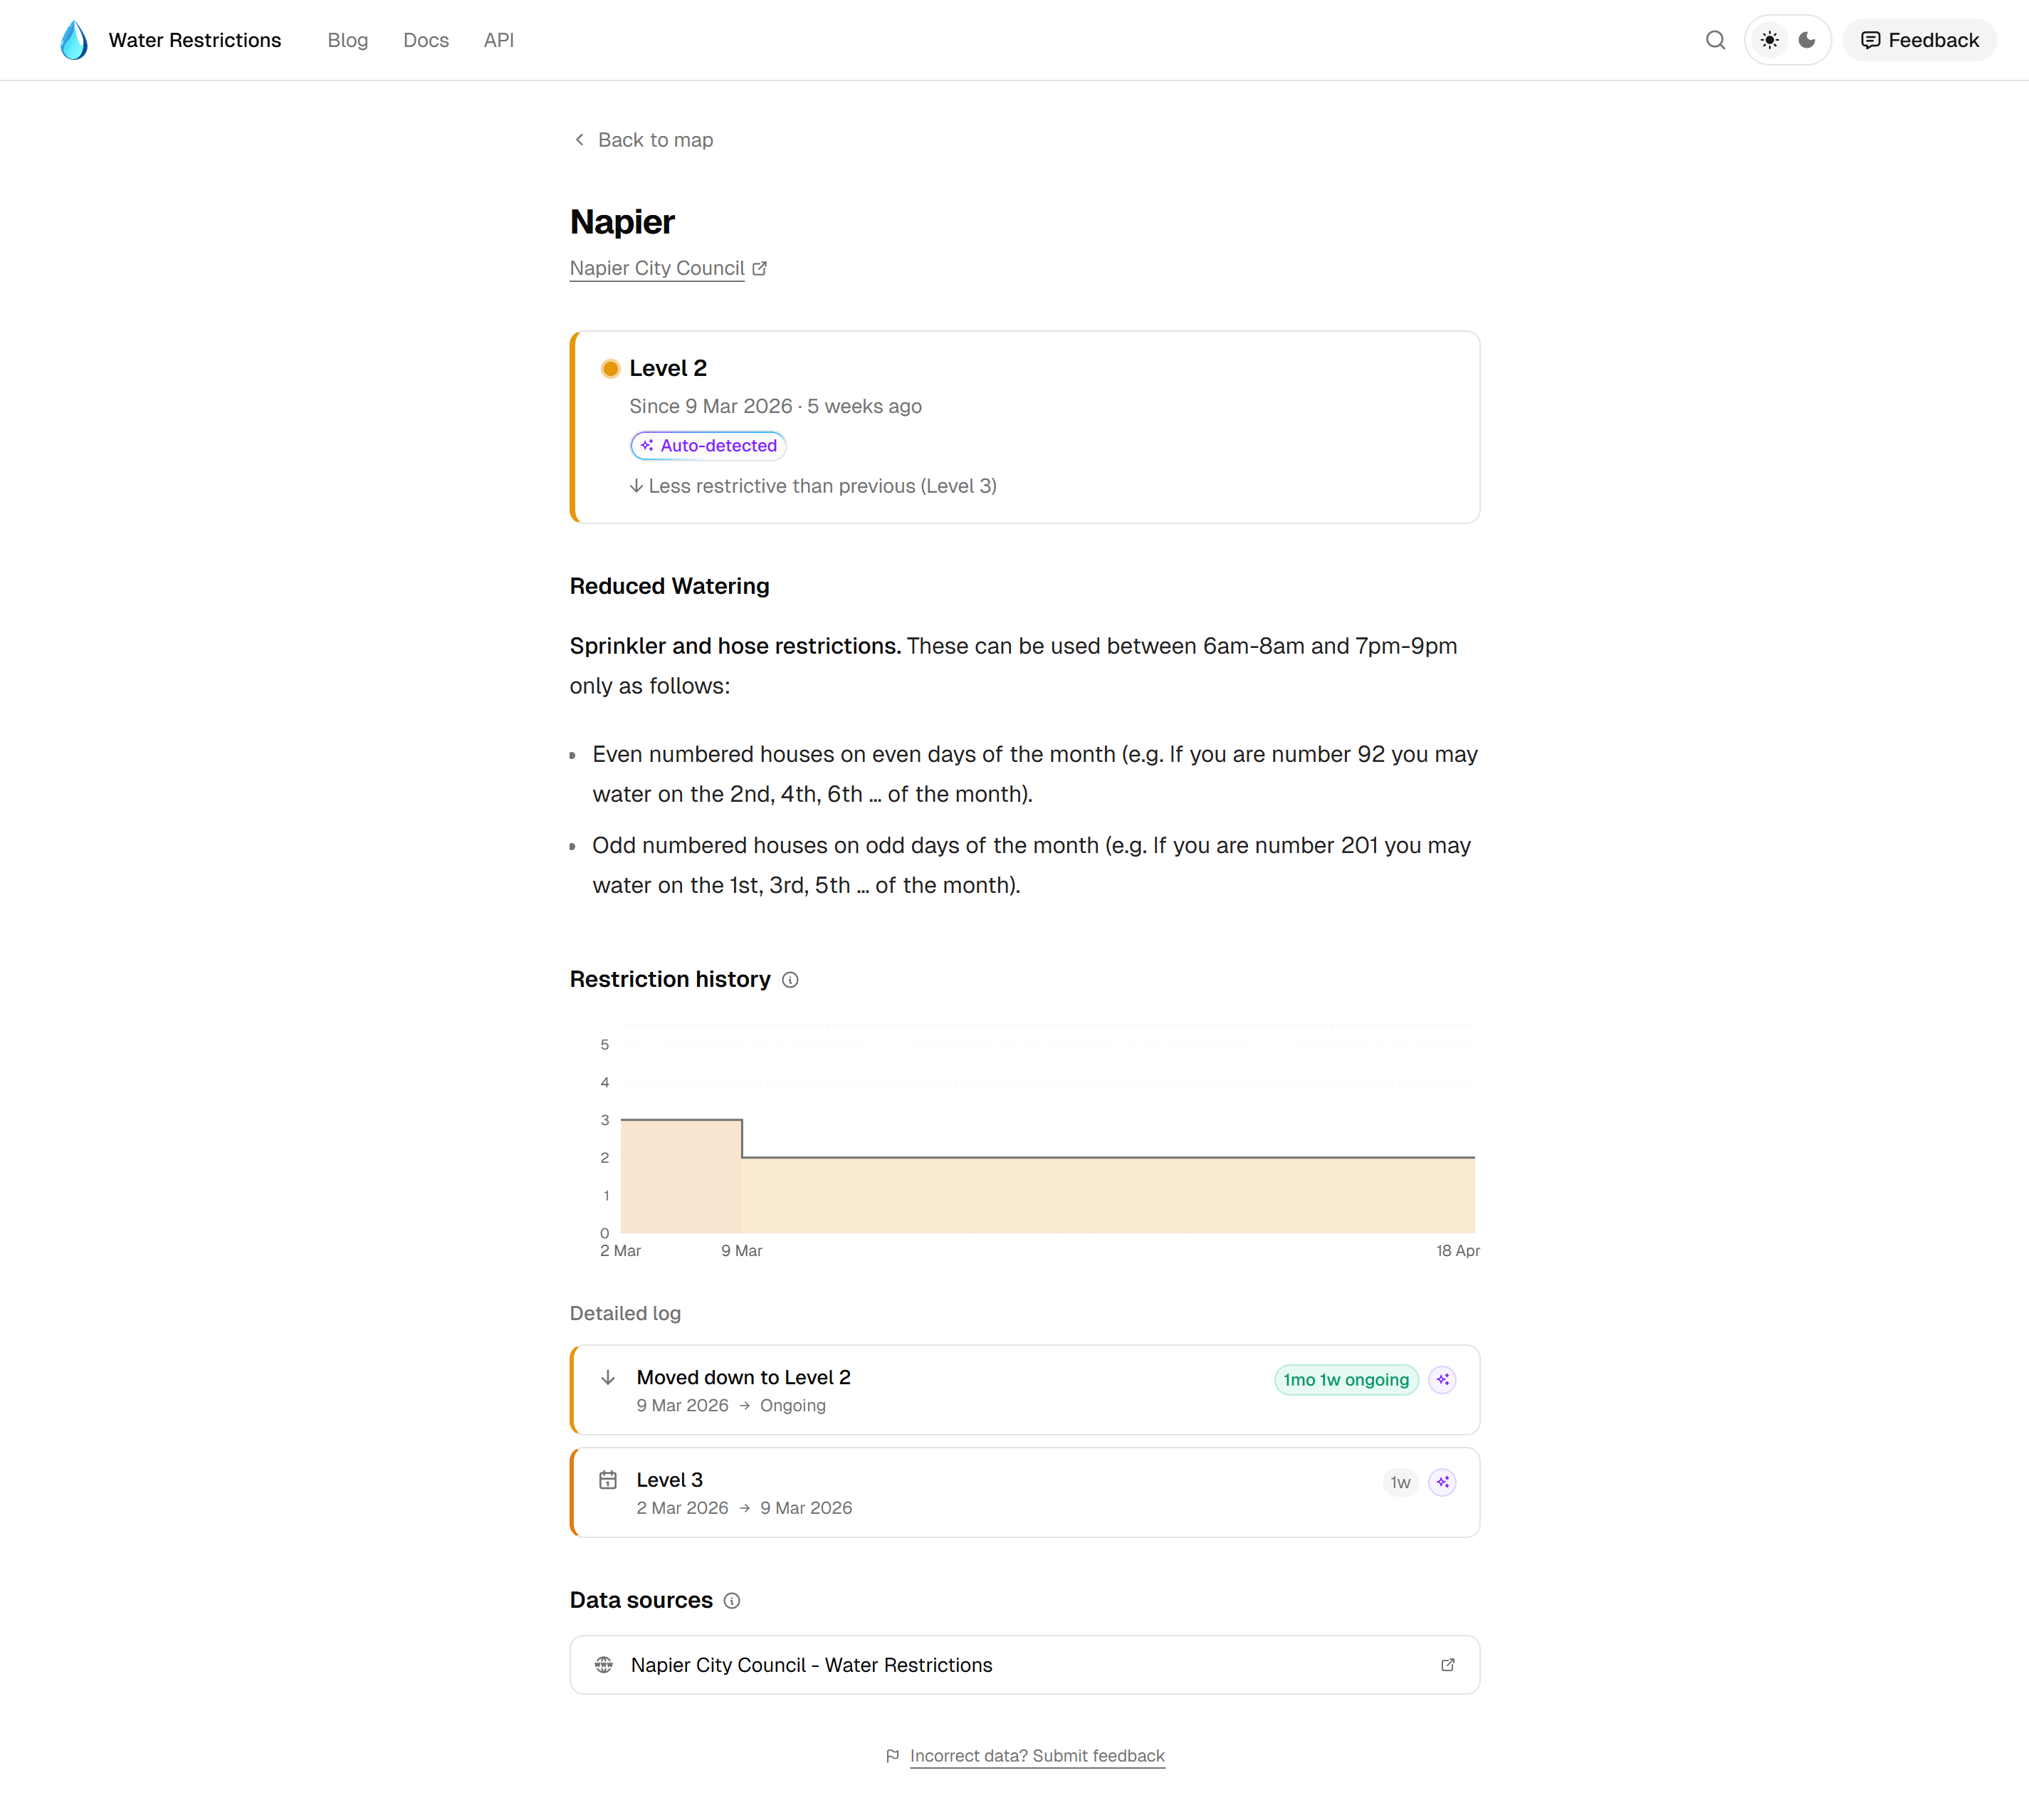
Where upcoming restriction changes have been detected and approved, the scheduled stage and effective date are shown on the area page. The detection and approval workflow is handled by the Water Restrictions API.
Restriction history is displayed as a step chart built with Recharts, alongside a log of individual stage assignments.
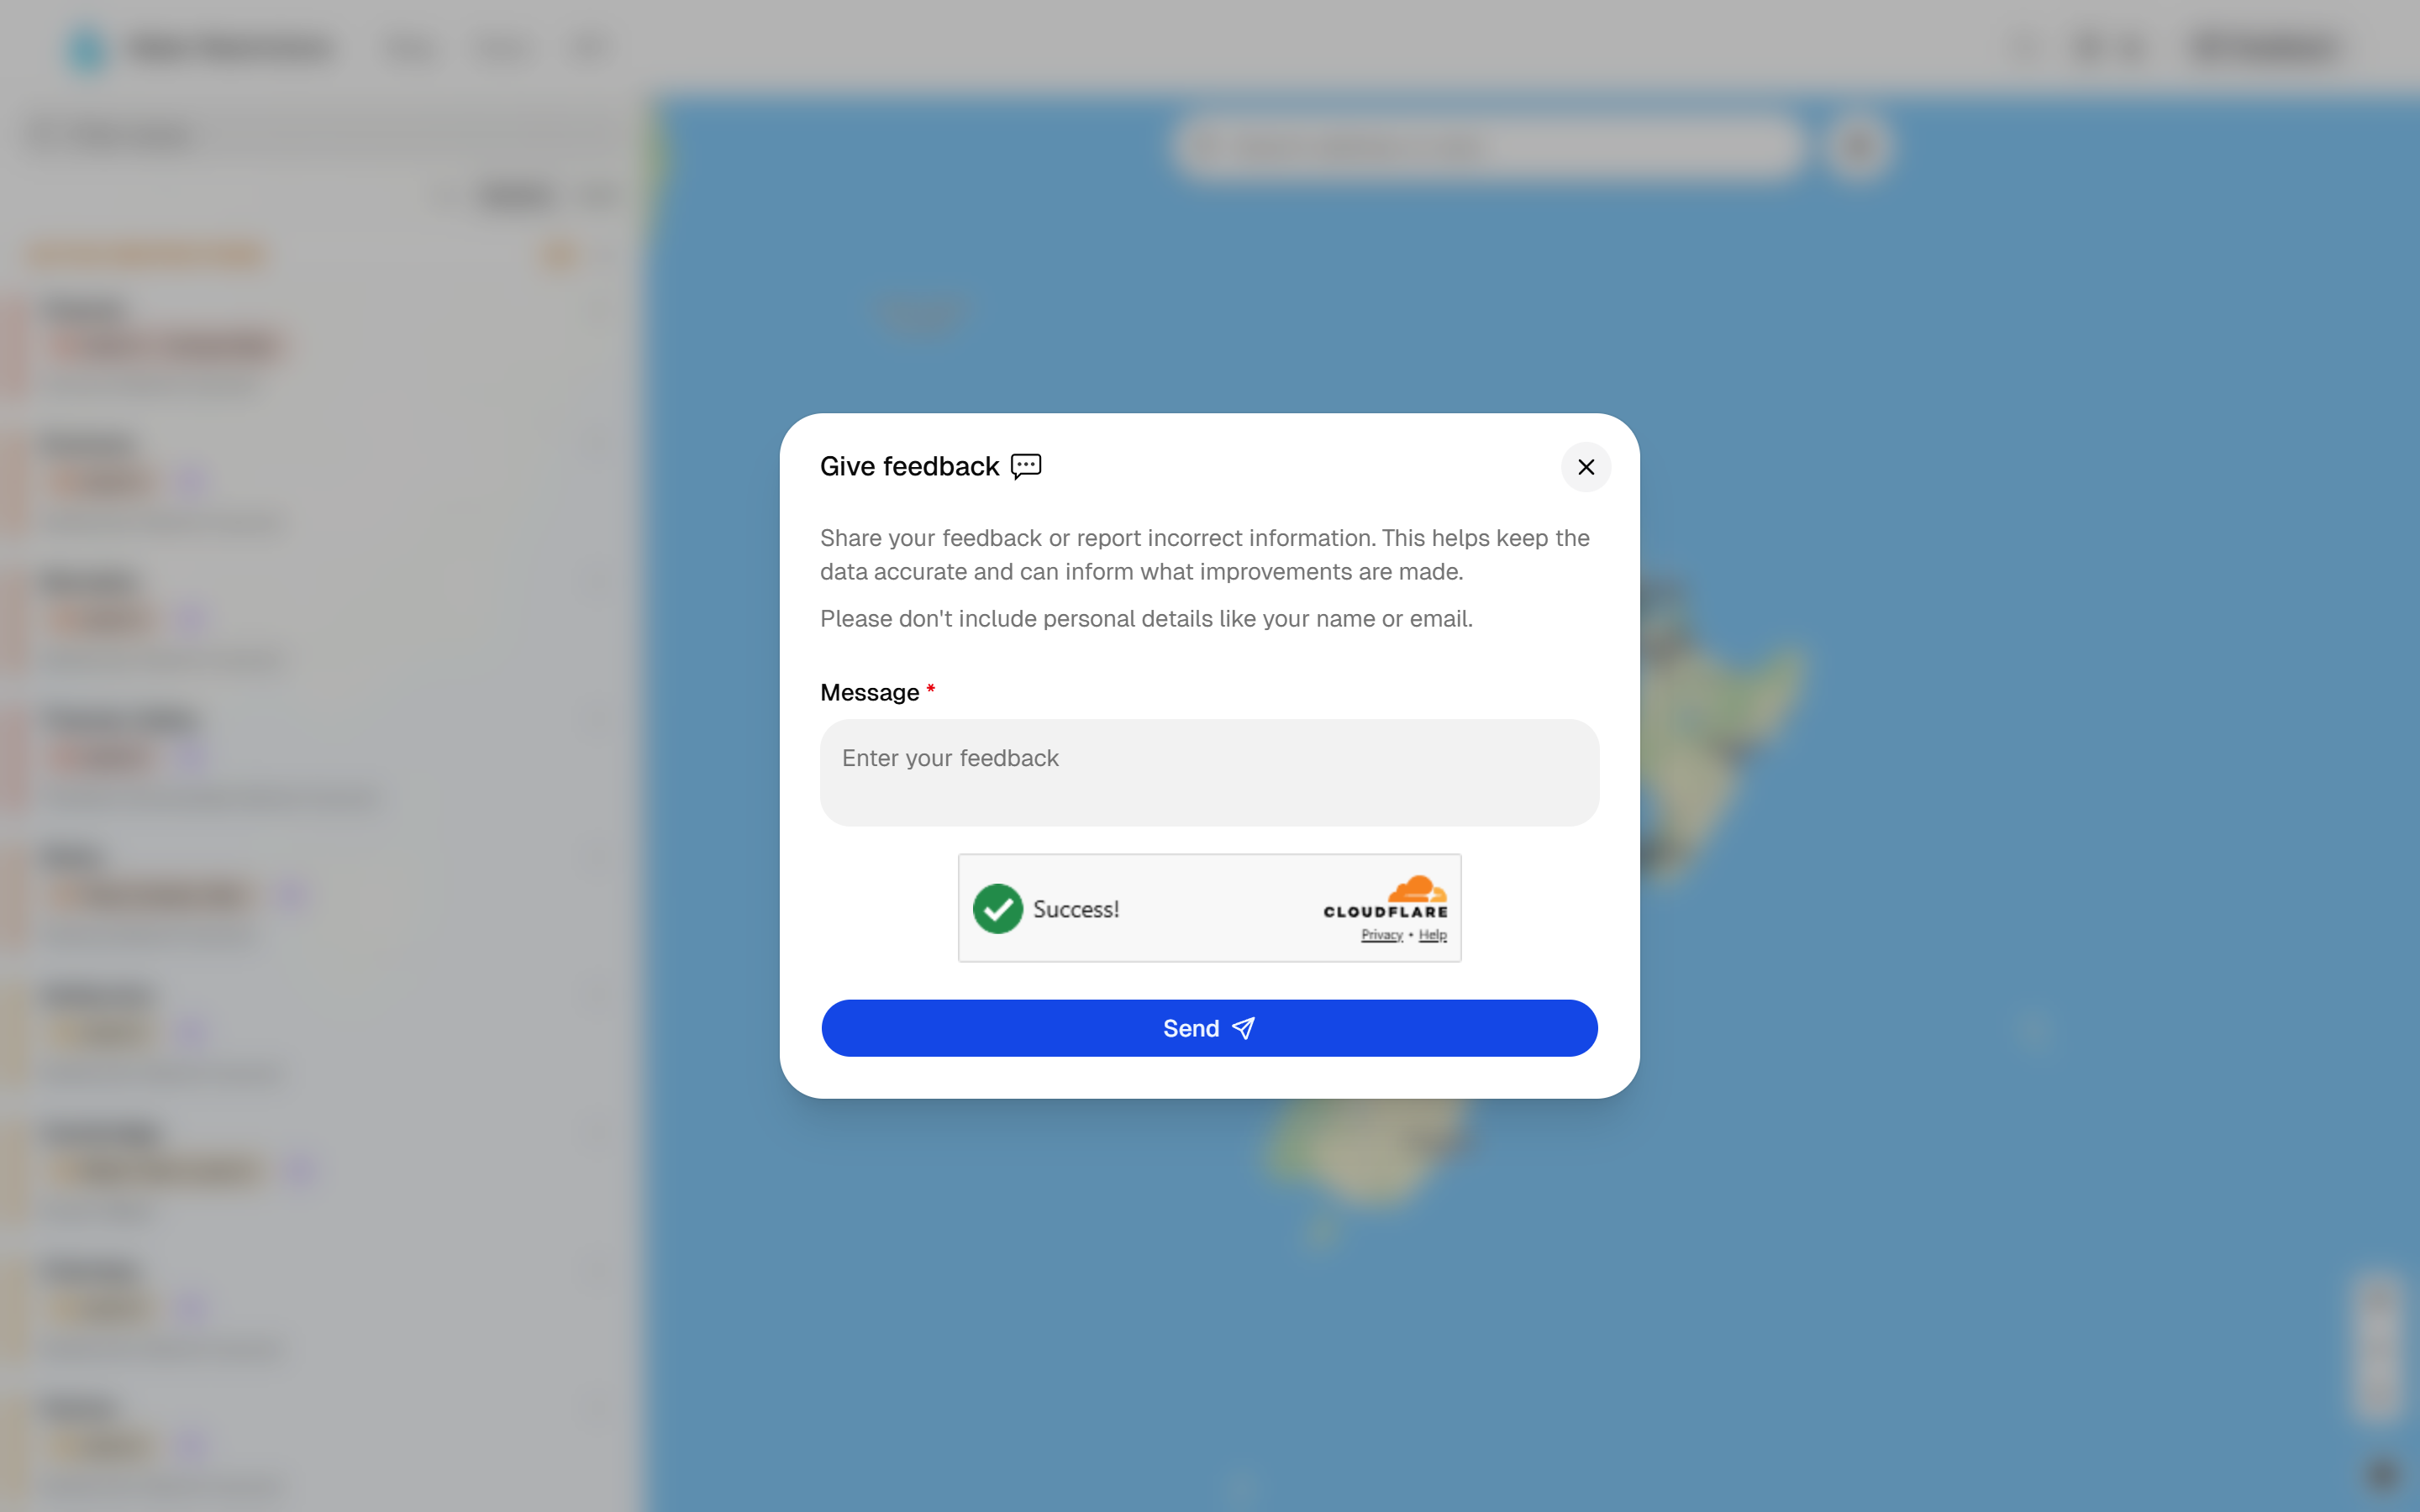
Feedback
Users can report incorrect or outdated restriction information directly from the area page. Submissions are protected by Cloudflare Turnstile and routed through the API, which dispatches a notification to a Discord channel for review.
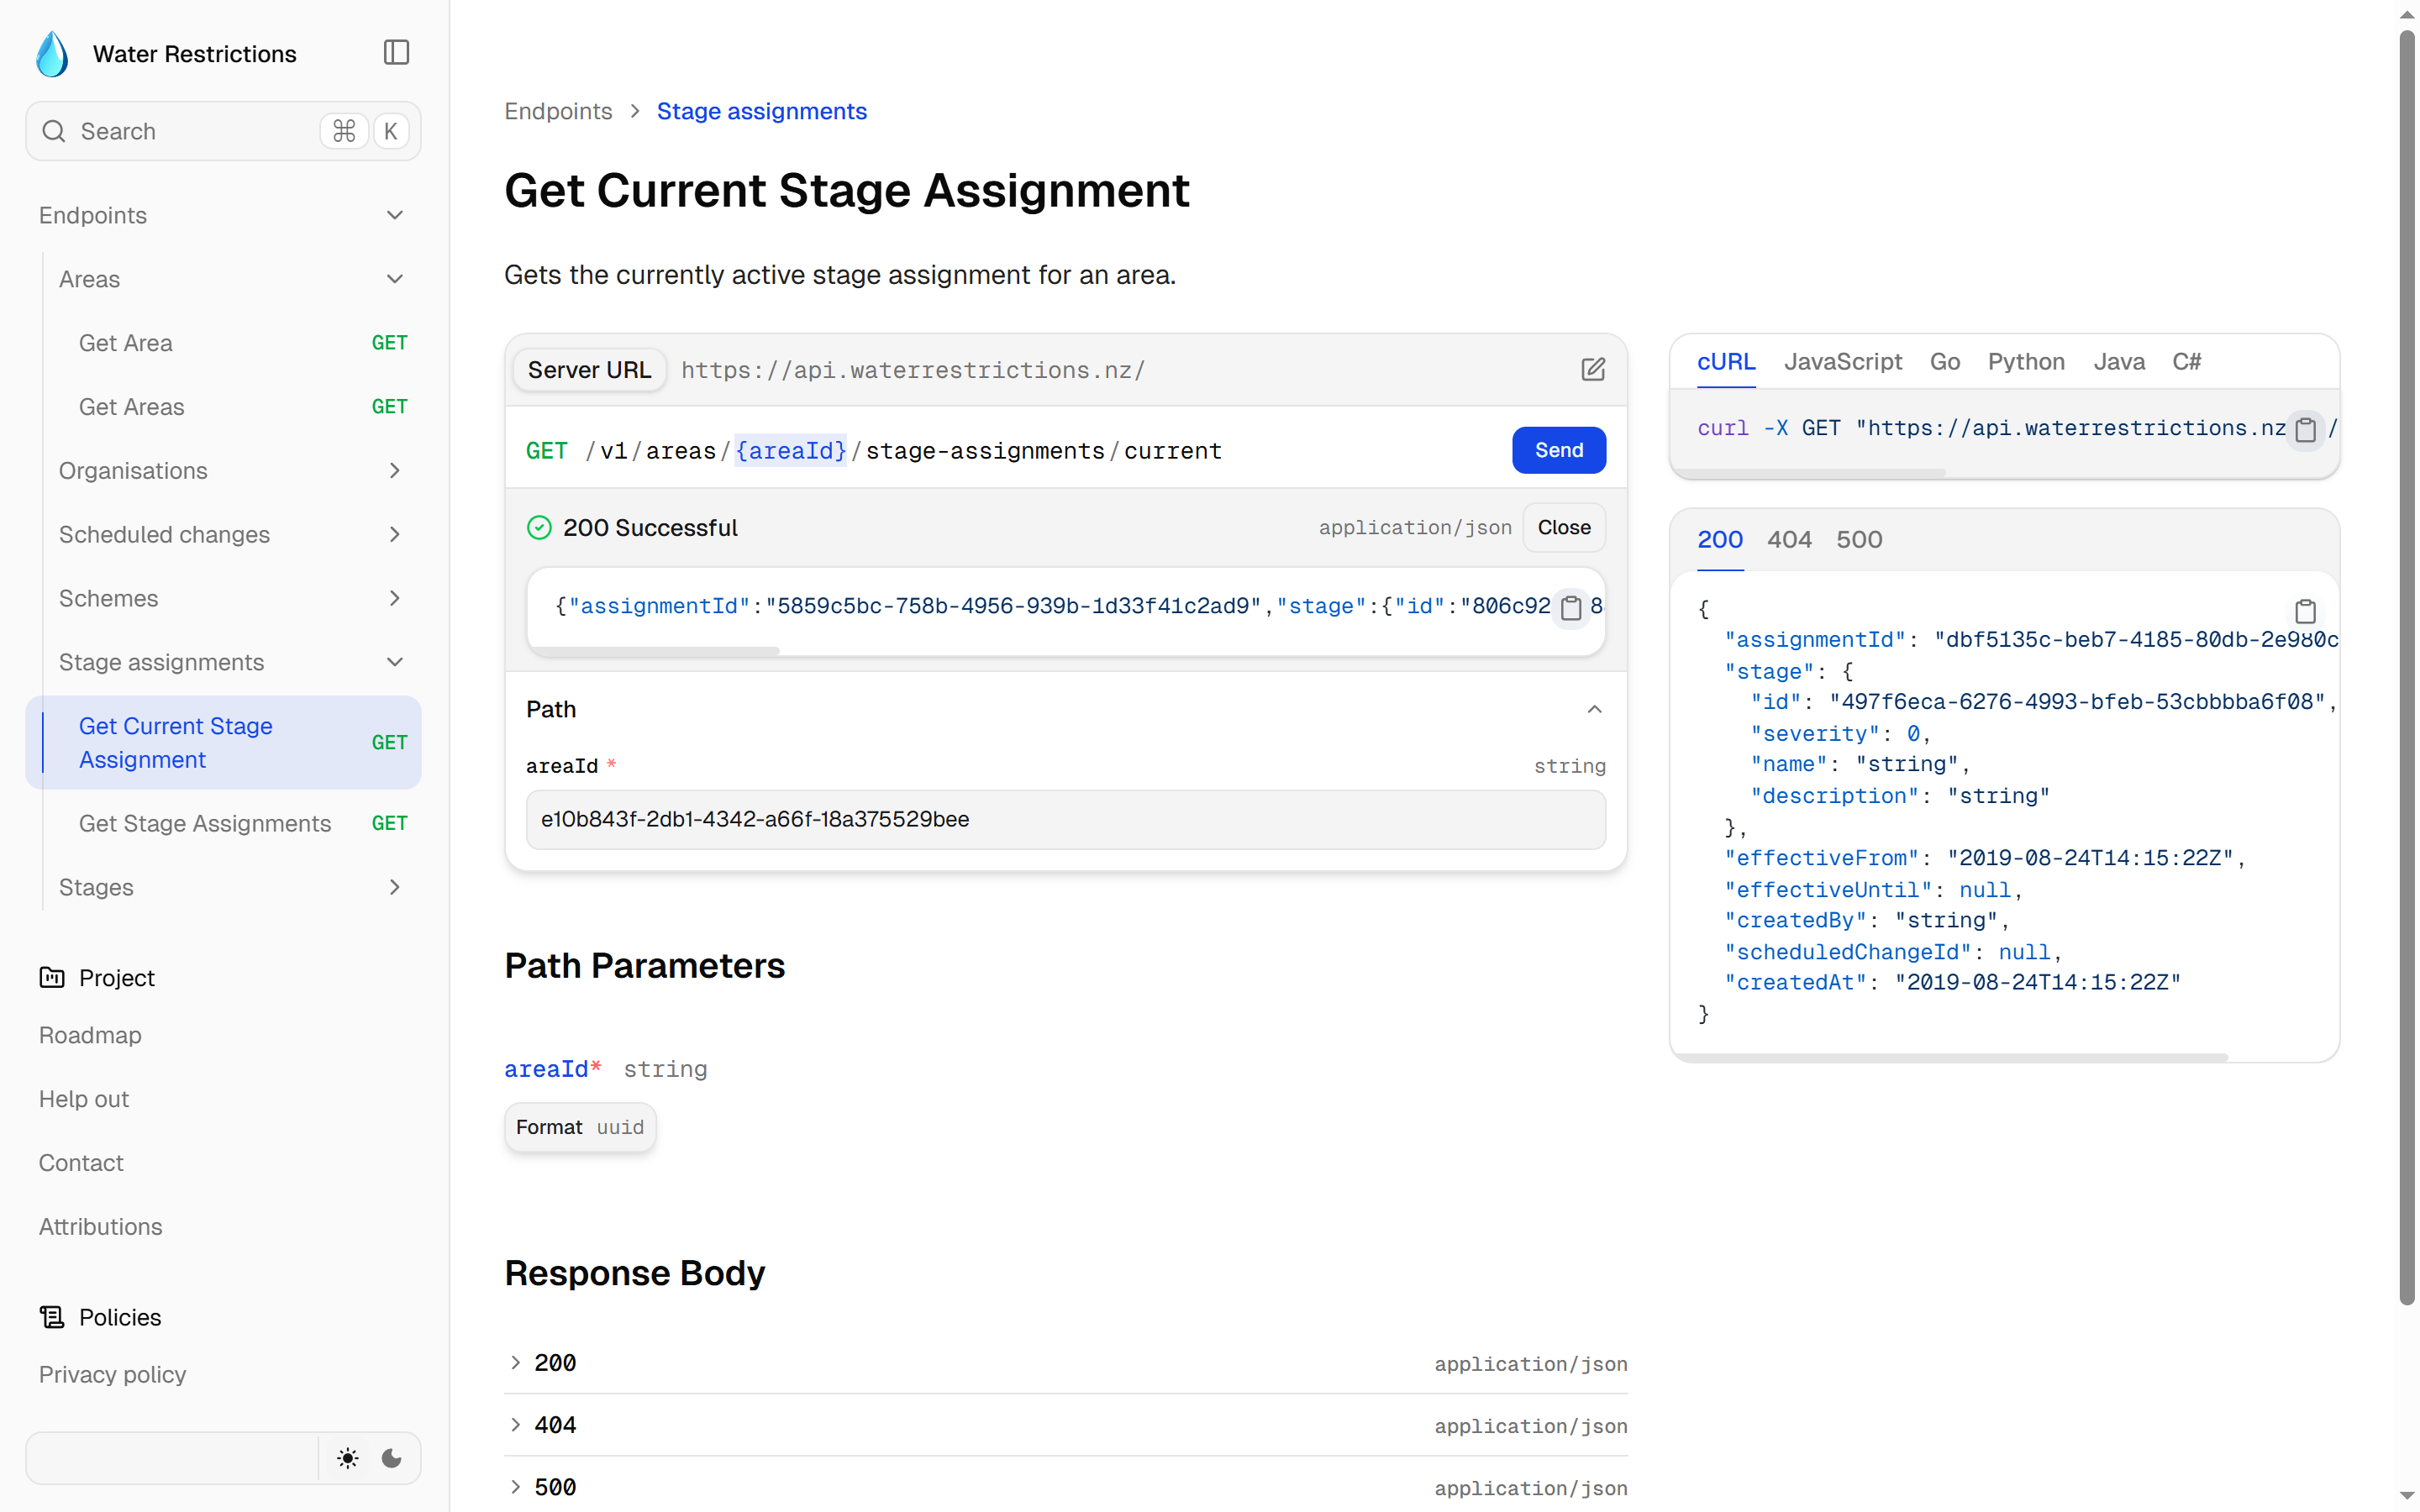
API documentation
API documentation is integrated directly into the website using Fumadocs, which includes a built-in API playground for testing endpoints in the browser — replacing the original Docusaurus-based docs site.
Stack
This project uses my standard stack setup.
- Frontend: Next.js 16 (React framework with SSR), shadcn/ui, Tailwind CSS v4, MapLibre GL JS (interactive map rendering), MapTiler (map tiles + geocoding search), Recharts (restriction history chart)
- Forms: Cloudflare Turnstile (feedback bot protection)
- Documentation: Fumadocs (documentation framework with built-in API playground)
- Development: Storybook (component development)
- Infrastructure: DigitalOcean App Platform (hosting), Terraform, GitHub Actions